Nature Communications: Record low Antarctic sea ice coverage indicates a new sea ice state
Record low Antarctic sea ice coverage indicates a new sea ice state
…
Abstract
In February 2023, Antarctic sea ice set a record minimum; there have now been three record-breaking low sea ice summers in seven years. Following the summer minimum, circumpolar Antarctic sea ice coverage remained exceptionally low during the autumn and winter advance, leading to the largest negative areal extent anomalies observed over the satellite era. Here, we show the confluence of Southern Ocean subsurface warming and record minima and suggest that ocean warming has played a role in pushing Antarctic sea ice into a new low-extent state. In addition, this new state exhibits different seasonal persistence characteristics, suggesting that the underlying processes controlling Antarctic sea ice coverage may have altered.
…
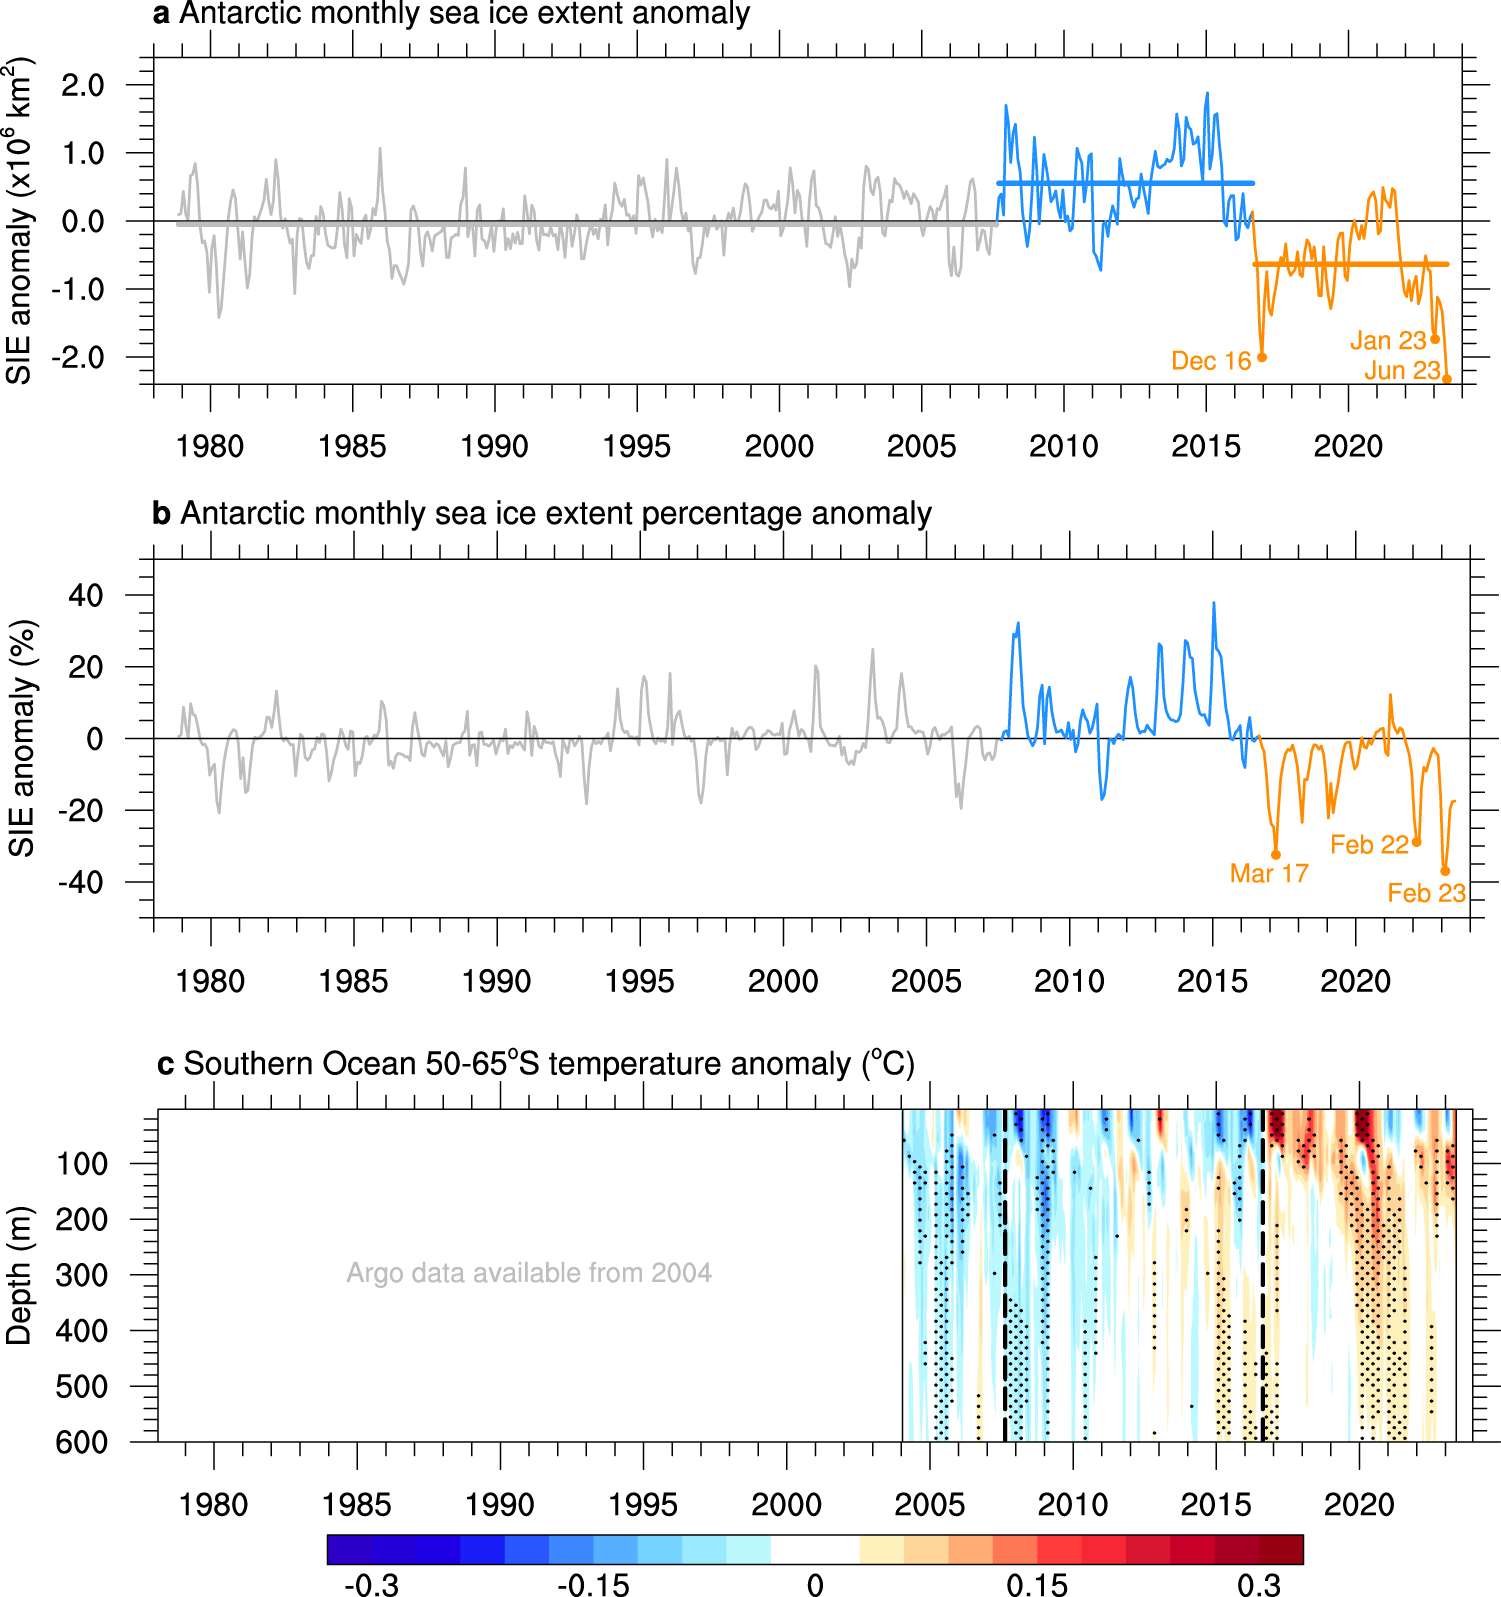
Fig. 1: Antarctic sea ice extent and Southern Ocean temperature anomalies showing the low sea ice and warm ocean state since 2016.
 a
a Antarctic monthly sea ice extent (SIE) anomaly time series from the National Snow and Ice Data Center over the satellite period, November 1978 to June 2023, in millions of square kilometres. Sea ice extent anomalies are calculated relative to the 1979–2022 climatology. Two change points are detected, separating the time series into three periods: November 1978 to August 2007 (grey), September 2007 to August 2016 (blue), and September 2016 to June 2023 (orange). The means of each period are shown by the horizontal lines and are statistically distinguishable.
b Antarctic monthly SIE anomaly time series expressed as a percentage of the monthly climatology over 1979–2022. Periods are coloured as in (
a). Record minima months occurring since 2016 are noted in (
a,
b).
c Southern Ocean 50–65°S temperature anomaly time series from Argo over January 2004 to May 2023, in degrees Celsius. Ocean temperature anomalies are calculated relative to the 2004-2022 climatology. Dashed vertical lines show the sea ice extent change points. Stippling indicates values outside ± 1 standard deviation, where the standard deviation is calculated independently at each depth level to account for the change in magnitude of the variability with depth. Warm anomalies shown in orange and red are evident below 100 m from 2015, and at the surface from late 2016.

