Welcome to DU!
The truly grassroots left-of-center political community where regular people, not algorithms, drive the discussions and set the standards.
Join the community:
Create a free account
Support DU (and get rid of ads!):
Become a Star Member
Latest Breaking News
Editorials & Other Articles
General Discussion
The DU Lounge
All Forums
Issue Forums
Culture Forums
Alliance Forums
Region Forums
Support Forums
Help & Search
Environment & Energy
Related: About this forumJames Hansen et al: Reflections on Time Scales and Butterflies
https://www.columbia.edu/~jeh1/mailings/2024/Reflections.2024.07.12.pdf
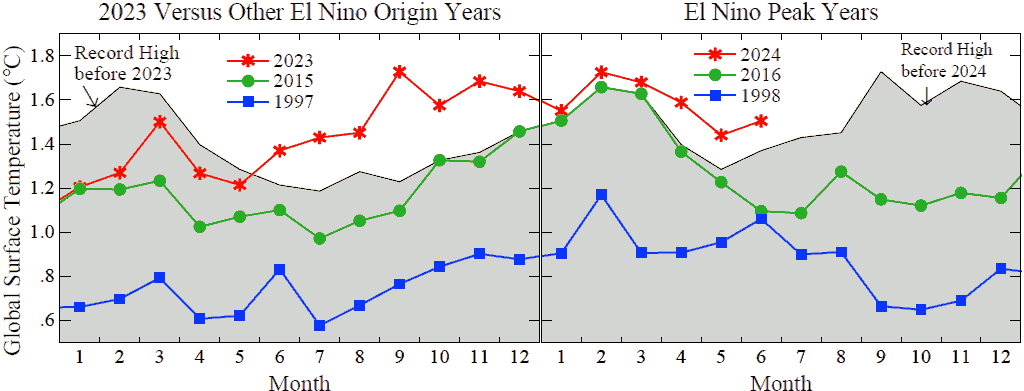
Fig. 1. Global temperature relative to 1880-1920 based on the GISS analysis.¹ ²
Reflections on Time Scales and Butterflies
12 July 2024
James Hansen, Makiko Sato, Pushker Kharecha
Abstract. Breathless reporting on when the present global heat anomaly will begin to fall is understandable, given heat suffering around the world. However, fundamental issues are in question and a reflection on time scales is in order, for the sake of understanding ongoing climate change and actions that need to be taken.
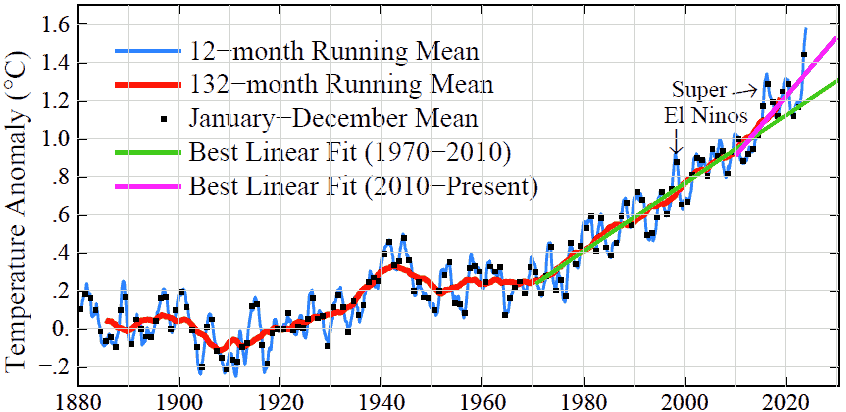
June was the 13 th consecutive record monthly global temperature (Fig. 1). The changing gap between this current string and prior records is revealing. The gap is smallest in Northern Hemisphere winter, the months when a strong El Nino gives global temperature the biggest kick, consistent with direct evidence that the recent El Nino was far from a super El Nino. Thus, more than the recent modest El Nino is needed to explain the uniquely large rise of temperature in the past year (Fig. 2).
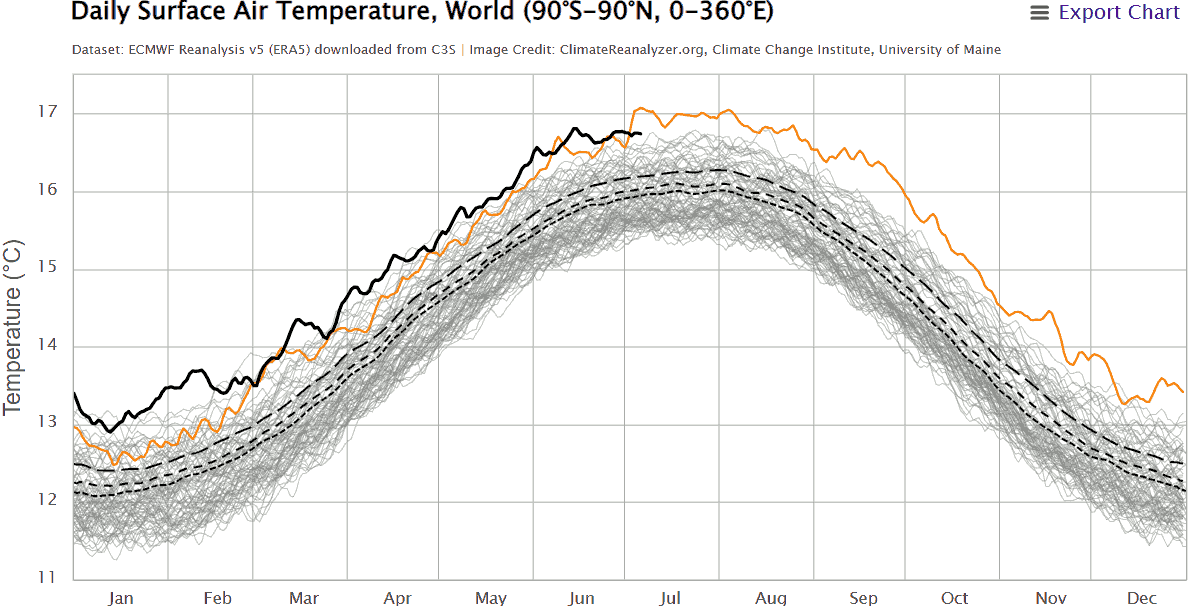
Reanalyses (computer simulations of global weather post facto, using available observations) show that the first week of July this year was cooler than in 2023 (Fig. 3). Nevertheless, we suggest caution in predictions about July and August for Fig. 1. Almost a dead-heat (sorry, no pun intended) with the 2023 July and August records is possible, even likely. In September, global temperature surely will fall well below the unusually-high September record (Fig. 1); with that, the 12-month running-mean global temperature (Fig. 2) will decline noticeably.

Fig. 2. Global temperature relative to 1880-1920 based on the GISS analysis. Warming rate is 0.18°C/decade for 1970-2010, 0.32°C/decade for 2010-present.

Fig. 3. Global surface air temperature from ECMWF reanalysis, provided by Univ. of Maine.³
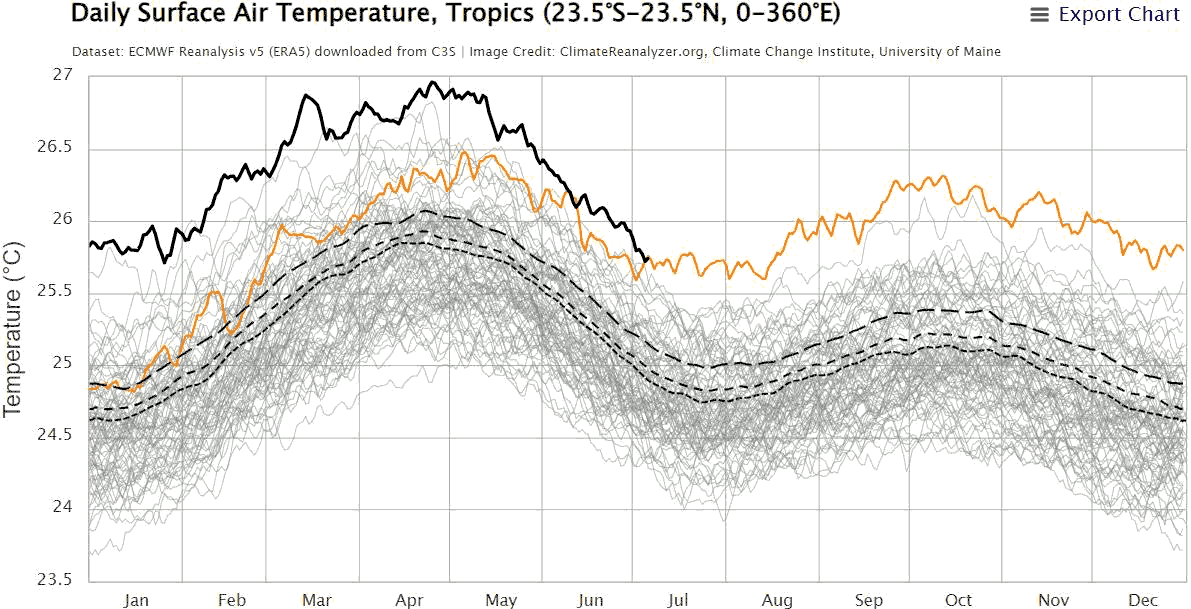
Tropical surface air temperature (Fig. 4) during the next few months is expected to fall below its El Nino-enhanced 2023 value – but how far below? Sea surface temperature (SST) is a less “noisy,” powerful, climate diagnostic because it serves as a measure of the entire depth of the ocean surface “mixed layer,” which is well-mixed almost daily by winds. The mixed layer accumulates effects of all the forcings at the ocean surface, capturing effects 24/7/365, not only at the moments of satellite sampling. Thus, SST reduces effects of weather noise, cloud variability, and sampling biases in satellite observations.
Global SST (Fig. 5) reveals the huge warming in the transition from La Nina at the beginning of 2023 to El Nino by mid-2023, exceeding the SST warming in even the strongest El Ninos. The magnitude and stability of the warming imply the need for a substantial mechanism(s) in addition to the El Nino, especially given the modest strength of the El Nino. Our suggestion4 for a large component of this additional forcing is aerosol forcing that grew especially during the 2020s. A sharp increase of aerosol forcing is expected in January 2020 due to regulations on sulphates in ship fuels. Aerosol forcing occurs mainly via effects on clouds that are highly nonlinear, being most effective in less-polluted air; thus, ship aerosols have a substantial impact, even though the ship portion of total human-made aerosols is small.

Fig. 4. Tropical surface air temperature from ECMWF reanalysis, provided by Univ. of Maine.
…
¹ Lenssen NJL, Schmidt GA, Hansen JE et al. Improvements in the GISTEMP uncertainty model, J Geophys Res Atmos 124(12), 6307-26, 2019
² Hansen J, Ruedy R, Sato M et al. Global surface temperature change. Rev Geophys 48:RG4004, 2010
³ This ECMWF reanalysis graphic is provided by the Climate Change Institute, University of Maine.
…