Environment & Energy
Related: About this forumIntersect Power to Build $837M Worth of Grid Batteries in Texas
The three Texas battery installations are expected to be up and running in 2024, helping provide more capacity to the state’s booming storage market.By Jeff St. John, 17 July 2024
Full Article: https://www.canarymedia.com/articles/energy-storage/intersect-power-to-build-837m-worth-of-grid-batteries-in-texas

Active construction at Intersect Power’s Lumina II battery energy storage system project in Scurry County, Texas. (Intersect Power)
-snip-
On Wednesday, Intersect Power announced $837 million in financing commitments for three battery projects in Texas, totaling nearly 1 gigawatt-hour of energy storage capacity. The financing includes portfolio-level construction debt and term debt financing from HPS and Deutsche Bank as well as tax equity financing from Morgan Stanley. It comes on top of the roughly $5 billion in project financing the Beaverton, Oregon, company has raised to date.
The three Texas battery installations — Lumina I, Lumina II, and Radian — are expected to be up and running in 2024. They will store solar power already flowing from Intersect’s 640 megawatt Lumina project and its 320 megawatt Radian project in Texas, helping provide additional flexibility to a state that outpaced California in solar deployment as of last year and is forecasted to beat California in energy storage deployment in 2024.
-snip-
Clean energy developers and energy market analysts agree that the U.S. grid isn’t being expanded quickly enough to build ever-cheaper solar, wind, and battery capacity at the pace needed to meet electricity demand. Nor is it moving fast enough to reduce carbon emissions in line with the country’s Paris Agreement goals.
Outside of Texas, energy project developers across the country face years-long wait times just to win the rights to interconnect to transmission grids. Even after the wait, those interconnection rights often come along with grid upgrade fees so high that developers opt to walk away from their proposed projects.
-snip-
Full Article: https://www.canarymedia.com/articles/energy-storage/intersect-power-to-build-837m-worth-of-grid-batteries-in-texas
 = new reply since forum marked as read
Highlight:
NoneDon't highlight anything
5 newestHighlight 5 most recent replies
= new reply since forum marked as read
Highlight:
NoneDon't highlight anything
5 newestHighlight 5 most recent replies

progree
(11,463 posts)There are a number of other very low carbon technologies other than solar and wind, but I don't see them expanding much in the next decade to make a significant difference enough to begin to meet the electrical demand forecast growths I've been reading about and to cover plant retirements, e.g. geothermal, hydro, nuclear...

Think. Again.
(17,942 posts)....we are nowhere near where we should have been to start seeing a decrease in CO2 emitting electric generation, and yes, both U.S. dirty electric genration and CO2 emissions are still expected to climb due to our inaction.
progree
(11,463 posts)Last edited Sat Aug 24, 2024, 08:23 AM - Edit history (20)
https://www.epa.gov/ghgemissions/sources-greenhouse-gas-emissionsEdited to add: Since the peak value of 2500 million metric tons of CO2 in 2007, it has fallen 38% to the 1542 million metric tons in 2022 and 43% from 2007 to the 1427 MMT in 2023-- see table below for the 2023 figure /End Edit
Graph title: Greenhouse Gas Emissions from Electric Power, 1990-2022
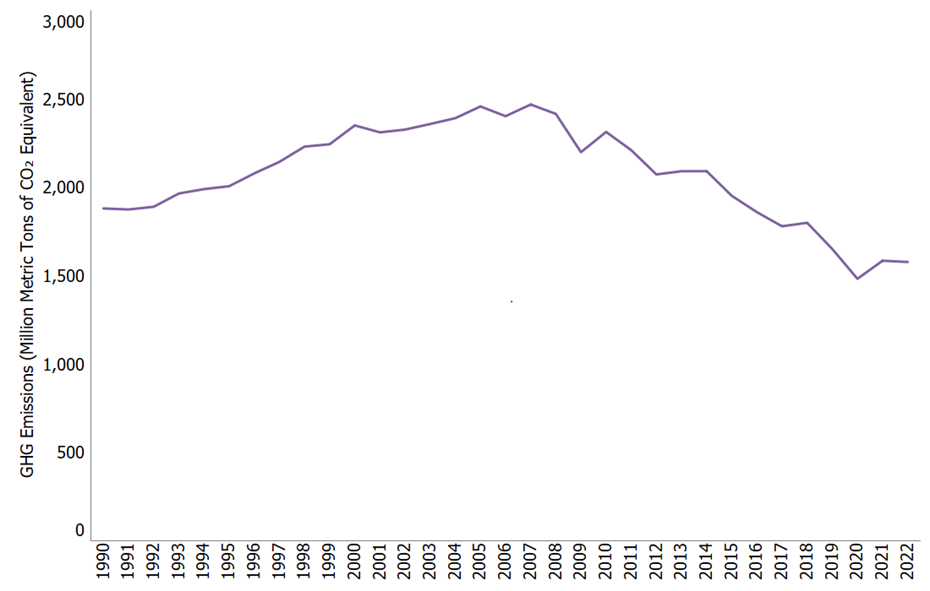
At bottom of graph: All emission estimates are sourced from the Inventory of U.S. Greenhouse Gas Emissions and Sinks: 1990–2022.
======================================
It shows an uptick in 2021 from 2020, which is probably recovery from the economic shutdowns / recession of 2020. And flat-line from 2021 to 2022 which might be more extraordinary economic recovery keeping it from what would otherwise be a continuing downward trend, hopefully.
It may be that some of the good news since 2007 may have been (besides shifts to solar/wind) is that coal fired generation being retired -- a lot of that was replaced with natural gas fired generation, but nat gas generation has about 60% the ghg per KWH -- see bar graph below (I edited the above ghg per Kwh from 2/3 to 60% End Edit). But that part of the trend may be running out of steam, so to speak, as there aren't as many coal-fired left to retire?
And if the big electric demand forecast increases due to AI and crypto mining actually occur ...
CO2 equivalent emissions, grams/KWH (entire life cycle)
https://world-nuclear.org/information-library/energy-and-the-environment/carbon-dioxide-emissions-from-electricity
The site blocks one from seeing anything with an email solicitation but eventually that goes away, takes at least 30 seconds, grr
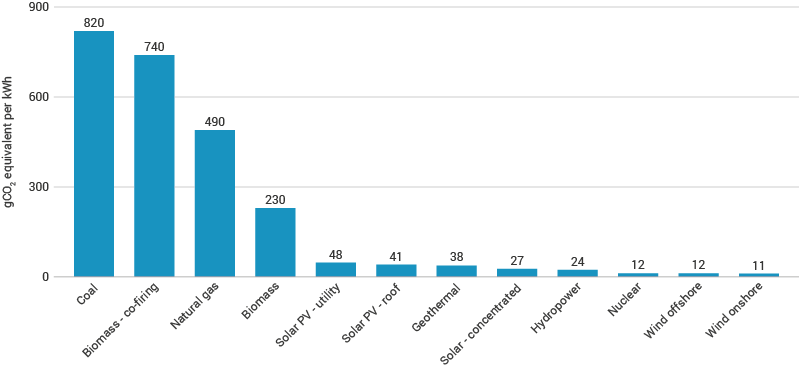
Figure 1: Average life-cycle CO2 equivalent emissions (source: IPCC)
This post has all three of the following:
https://www.democraticunderground.com/1127175045#post3
(#1#) Steel, concrete, glass, and "other" requirements of the various electric power sources per TWH of electricity generated
(#2#) land use efficiency of the various power sources, watts per square meter
(#3#) CO2 equivalent emissions / Kwh (same as above section)
Edited to add
I figured there might be 2023 numbers out there somewhere. I found this, which is CO2 emissions, not total GHG emissions unlike my stuff above, but oh well. Anyway, it shows a 7.4% drop (edited from incorrect 2.7%) in CO2 emissions from the U.S. electric power sector from 2022 to 2023, from 1542 to 1427 million metric tons .
Edited to add: they say some of this drop was due to a mild winter /Edit
https://www.eia.gov/environment/emissions/carbon/
Edited 7/19 630 PM ET to replace the table that was here -- in reverse chronological order -- with a new table in normal chronological order and with the columns lined up. And with the % increase column added /Edit

Data source: U.S. Energy Information Administration, Monthly Energy Review, March 2024, Tables 11.1–11.6
Note: Totals may not equal sum of components due to independent rounding.
EDITED TO ADD: note all the sectors are below their 2019 levels /End Edit
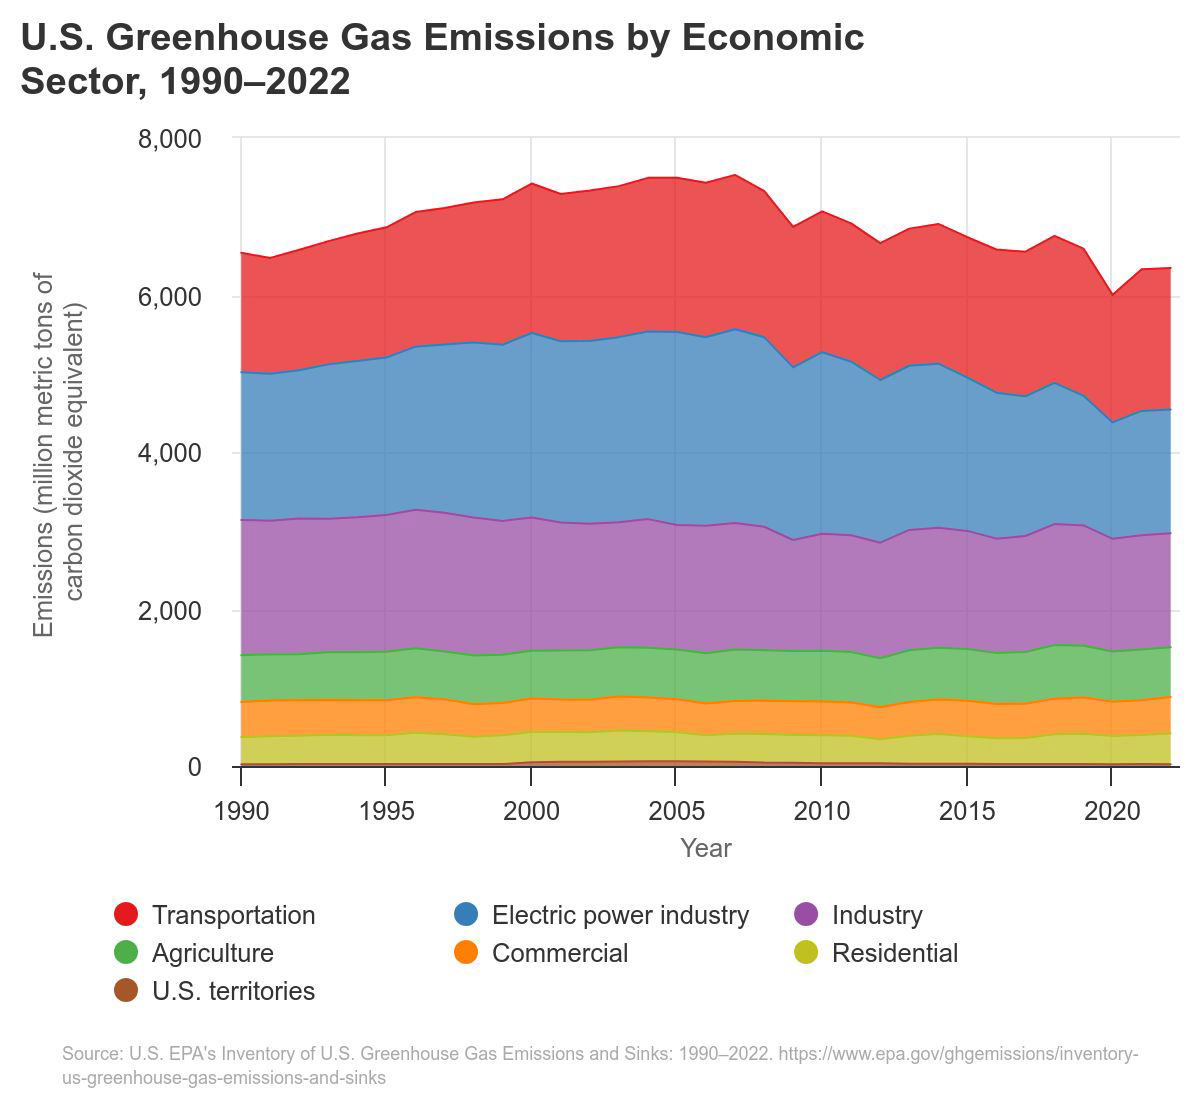
EDITED TO ADD 8/24/24 - Carefully measuring the width of the power sector blue band in the "U.S. Greenhouse Gas Emissions by Economic Sector, 1990-2022" graph BELOW, I find that the GHG emissions from the 2007 peak to 2022 declined by 36.5%.
Late Edited to add the following graph, 7/17 1142 PM ET
https://www.epa.gov/ghgemissions/inventory-us-greenhouse-gas-emissions-and-sinks
Edited to add 7/19 1125 AM ET
I was wondering about the U.S. electrical load -- is some of the reduction of GHG emissions since 2007 in the _U.S._ electric power sector because of a reduction in U.S. electricity production/consumption? I always thought that for the past 2 or more decades electrical demand had been growing slowly like 1% to 2% a year or somesuch. Turns out that it has been virtually flat since 2010
https://www.statista.com/statistics/201794/us-electricity-consumption-since-1975/
bar charts with numbers that pop up when hover mouse
includes direct use (TWH)
2010: 3,887,
...
2019: 3,954 (last pre-pandemic year)
2020: 3,856,
2021: 3,945,
2022: 4,067,
2023: 4,000 TWH.
So in the 13 years from 2010 thru 2023, electrical consumption has grown 2.907%. That's a compound average annual growth rate of 0.221%/year.
Note: yesterday I had full access. This morning, I didn't -- it blocked the graph and most of the page with a notice that I needed a paid account. I tried a different browser. I tried archive.org snapshots in July and December -- same thing. Finally I thought of doing a Google search
https://www.google.com/search?q=U.S.+electricity+consumption+year+by+year
and from the list of results I clicked on the Statista link and wasn't blocked. YMV.
Interesting factoid: Texas is the leading electricity consumption state (470 TWH), followed by California and Florida approximately 250 TWH. So that's some context in the giddy bubbly boo about how Texas is such a great renewable energy state -- they consume (and produce) nearly twice as much total electricity as their nearest rivals.
This one has through 2022
https://www.eia.gov/energyexplained/electricity/use-of-electricity.php
This one through 2023, but doesn't have direct use, which is about 140 TWH/year
https://www.eia.gov/electricity/monthly/epm_table_grapher.php?t=epmt_5_01
((No direct use shown anywhere -Progree))
Electric Power Monthly
Table 5.1. Sales of Electricity to Ultimate Customers:
Nothing in the above is part of a nefarious agenda on my part. I am not saying that since its been essentially flat for more than a decade that it will remain flat. I just felt the picture of ghg of the _U.S._ electric power sector is incomplete without knowing what the electrical production / consumption is. (Production and consumption differ by transmission losses, and probably even "direct use" does not include power plant electricity to run their pumps and pollution control equipment).
I'm mostly just documenting for myself the U.S. electric power power sector, so I can look up all this stuff with the click of a link. Realizing, as always, that the U.S. electric power sector is a small percent of the worldwide total of all sectors in all countries.
EDITED TO ADD 7/20 740 AM ET -
83.9% of U.S energy production is fossil fuel, while wind and solar combine to only 2.3% ughh:
EIA Table 1.2 in interactive: https://www.eia.gov/totalenergy/data/browser/index.php?tbl=T01.02#/?f=A&start=200001
. . . in PDF: https://www.eia.gov/totalenergy/data/monthly/pdf/sec1_5.pdf
TABLE 1.2 PRIMARY ENERGY PRODUCTION BY SOURCE
In 2023, in quadrillion BTUs: Fossil fuels: 86.2325, Nuclear: 8.1008, Wind+solar: 2.3284, Other: 6.0979, Total: 102.7597
So as percentages of total, I calculate:
Fossil: 83.9%, Nuclear: 7.9%, Wind+Solar: 2.3%, , everything else: 5.9%, Total energy: 100%
I'll have to dig into the important details. For example (#1#) on fossil fuel production, does that include net exports? (#2#) And how does one assess the production of a fossil-fueled fired electric power plant (or nuclear power plant), that converts only about 40% of the energy content of the fuel into electrical energy (throwing the other 60% away), as compared to wind and solar that convert these resources straight into electricity? I know some info resources that convert say the 1 TWH output of a wind farm by multiplying it by, say, (100%/40%)= 2.5 TWH of equivalent primary energy. Then they convert to BTU at the theoretically perfect 3412 BTU/KWH (3.412 BTU per watthour) with the result of 8.53 trillion BTUS (or 0.00853 quadrillion BTUs) of equivalent primary energy.
The footnotes on this page probably explains #2 above (where will have to click on some of the links in the footnotes and then read all that crap, but yes, it appears that they do something like what I described above)
. . . https://www.eia.gov/energyexplained/us-energy-facts/
An Exajoule is 10^18 joules. An Exajoule is an SI unit of energy. To get the above quadrillion BTU numbers into Exajoules, multiply the above by 1.055056 EJ per quad. So, for example, the total energy 102.7597 quadrillion BTUs is 108.4172 Exajoules.
ENERGY CONSUMPTION SHARES, 2023: Totals 93.59 quadrillion BTUs. There is a pie chart breakdown of the components. The fossil share is 83%, nuclear is 9%, solar and wind combined is 2.6% and other renewables is 6.4%. The other renewables -- in descending order of size -- are biomass, hydroelectric, and geothermal)
The Energy Consumption shares above is from the pie chart in the us-energy-facts link above
Think. Again.
(17,942 posts)The forecasted demand from Data processing, AI, Crypto, population growth, etc, is expected to outpace the slowed-down replacement of CO2-emitting plants with clean plants.
But again, those numbers you posted, even the covid era low-usage numbers, are still waaaay too high for what we should be doing to have any substantial affect on the near future climate damages we can expect.
progree
(11,463 posts)Last edited Sat Jul 20, 2024, 12:43 PM - Edit history (1)
From EIA Table 1.2. In 2023.
This is entire U.S. (not just the electric power sector which is otherwise the focus of post #3)
Also added:
ENERGY CONSUMPTION SHARES, 2023: Totals 93.59 quadrillion BTUs. There is a pie chart breakdown of the components. The fossil share is 83%, nuclear is 9%, solar and wind is 2.6% and other renewables is 6.4%. The other renewables -- in descending order of size -- are biomass, hydroelectric, and geothermal)
Finishline42
(1,115 posts)Storage allows for the load shifting from when there is an over supply of power generation to when there is an over demand.
And yes, anybody expecting CO2 to go down is living in dreamland. Looking at the data from when COVID shut down the World's economy there is not even a blip of a decrease in CO2. Especially in the early stages when so many were staying home, large building weren't being used, still not a dip in CO2.
But here's info on Texas and solar...
Texas added more solar capacity than any other state in 2023 — topping California for just the second time — according to a new report, which attributes the growth to a boom in utility-scale projects.
https://www.govtech.com/products/central-texas-experiencing-boom-in-new-solar-farms
progree
(11,463 posts)On the "not even a blip" -- This one shows a 5.5% decrease worldwide from 2019 to 2020. I don't know what the definition of "blip" is when it comes to CO2; maybe 5.5% doesn't quite make it to blip territory. Is it a sub-blip? And in 2021 it was below its 2019 level as well.
https://www.statista.com/statistics/276629/global-co2-emissions/
Annual carbon dioxide (CO₂ ) emissions worldwide from 1940 to 2023 (in billion metric tons)
Characteristic Emissions in billion metric tons
2018 36.77
2019 37.04
2020 35.01
2021 36.82
2022 37.15
2023 37.55
My posts up thread were, as clearly specified, solely about the U.S.electric power sector, and didn't predict that the turndown that began in 2007 in that sector would continue. In case anyone reading this thread is confused about that.
progree
(11,463 posts)I know its not fast enough progress, and the progress might not continue or slow down substantially.
And that #3 above is all about the U.S., while the world as a whole is quite a different story, and is what matters to the planet's atmosphere.
I was just interested to see what the U.S. part of it is, and where it might be going.
Caribbeans
(975 posts)Every one of these battery modules will need replacement one day - because all batteries made today start to die the day they come out of the factory.
Expected lifespan of the modules?
Cost of replacement?
How many homes will this installation serve and for how many hours?
What Causes Lithium-ion to Age?
https://batteryuniversity.com/article/bu-808-how-to-prolong-lithium-based-batteries
Greener energy storage on a larger scale:
Think. Again.
(17,942 posts)Yet to be answered.
But as I think you know, the continued research and development of the very young energy storage industry will be one of the necessary steps we will have to be taking to build out any of the alternatives to CO2 emitting energy generation.
We are going to need a LOT of ALL the different energy related clean technologies that we have, and we will hopefully discover even more ways to power our mess, because I personally don't believe we are going to be willing to decrease our energy usage, unless and until we no longer have a choice.
progree
(11,463 posts)Since 2010 thru 2023, U.S. electricity consumption has grown only 0.22%/year. (No, I'm not saying that therefore it will be flat forever. Just to provide context to the U.S. electric power sector GHG emissions info in that post. No predictions from me, I'm just still figuring out where we've been up to this point).
In the process I discovered that Texas annually consumes (and produces) nearly twice as much electricity, 470 TWH, as its nearest rivals, California and Florida at 250 TWH each. Just a little context when considering the claims that Texas outpaced California in solar and will soon in battery storage -- well they should since they produce/consume almost twice as much electricity. As a share of total electric energy consumption, Texas is substantially behind California in solar and battery capacity.
Context context context.
Think. Again.
(17,942 posts)...that 2.9% increase in consumption from 2010 to 2023 that your research show is definitely not good considering the covid years it covers. And I'm assuming the data-processing growth will only make things worse.
And the electric power related CO2 emissions growth from 2019 (1,427 mmt) to 2023 (1,618 mmt), which was pretty much the entire covid period, is definitely ominous considering the increases in clean electric generation during that same time.
As the article mentions, we are still way too far behind in reaching even the low expectations of the Paris agreement. We just don't have a lot more time to get the clean energy ball rolling.
And I do find it ironic that oil-rich Texas is making the fastest gains so far, but certainly glad to see it especially since, as you pointed out, Texas has such a high electricity consumption rate!
progree
(11,463 posts)Last edited Fri Jul 19, 2024, 09:35 PM - Edit history (1)
It's the other way around. Here is the table in #3 again as it was when you posted
https://www.democraticunderground.com/?com=view_post&forum=1127&pid=175002
Table 1. Total U.S. energy-related CO2 emissions by sector, 2019–2023
million metric tons of carbon dioxide
2023 2022 2021 2020 2019 Sector
311 339 325 319 347 Residential
250 261 245 233 255 Commercial
963 960 977 952 1,007 Industrial
1,856 1,840 1,807 1,630 1,921 Tranportation
1,427 1,542 1,551 1,450 1,618 Electric Power
4,807 4,941 4,905 4,584 5,147 Total
I decided to put it in chronological order, since reverse chronological order is confusing and there's no good reason for it being bassackward. I also added a % increase from 2019 to 2023 column while I'm at it. And to line up the columns. So here is the new table:
As shown in the graphs in #3, these declines are continuations since 2007, so it's not something I feel can be totally blown off as something that occurred because of Covid. But yes, it will get harder as there are fewer coal-fired left to shut down, and expected electrical consumption increases.
And Texas's solar starting from a considerably smaller share of total electricity than California, so yes, I'm glad to see they are in the direction of starting to close that share gap. I'll be giddy bubbly boo about Texas once they reduce their fossil fuel share percentage to below that of California.