Welcome to DU! The truly grassroots left-of-center political community where regular people, not algorithms, drive the discussions and set the standards. Join the community: Create a free account Support DU (and get rid of ads!): Become a Star Member Latest Breaking News Editorials & Other Articles General Discussion The DU Lounge All Forums Issue Forums Culture Forums Alliance Forums Region Forums Support Forums Help & Search
OKIsItJustMe

(20,733 posts)
Wed Oct 9, 2024, 05:14 PM Oct 9

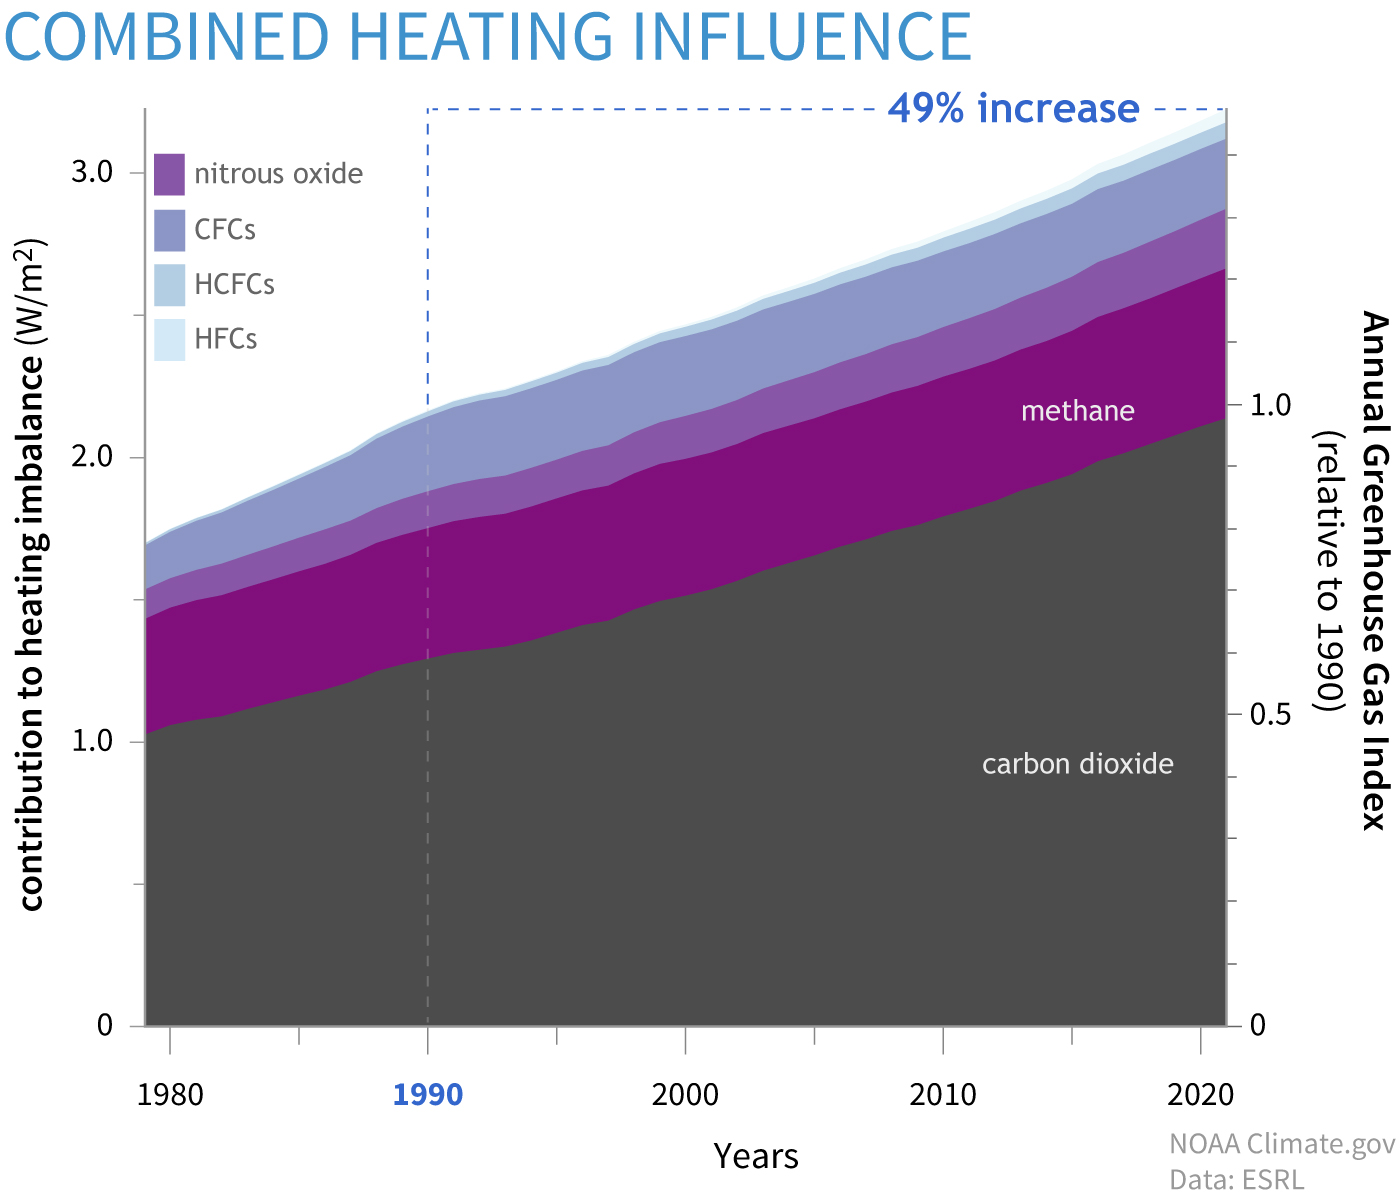
A sobering graph

https://www.climate.gov/media/14599

This graph shows the heating influence caused by the major human-produced greenhouse gases: carbon dioxide (gray), methane (dark purple), nitrous oxide (medium purple), chlorofluorocarbons (CFCs, lavender), hydrochlorofluorocarbons (HCFCs, blue), and hydrofluorocarbons (HFCs, light blue). Relative to conditions in 1750, today's atmosphere absorbs more than 3 extra watts of energy per square meter of Earth's surface. Graph by NOAA Climate.gov based on data from NOAA Global Monitoring Lab. For the complete list of chemicals in the CFC, HFC, and HCFC groups, see Figure 3 in the Full AGGI Report.Graph by NOAA Climate.gov based on data from NOAA ESRL.
Latest Discussions»Issue Forums»Environment & Energy»A sobering graph