Science
Related: About this forumA New Record Concentration for CO2, 427.98 ppm Has Been Set for the Mauna Loa CO2 Observatory's Weekly Average.
As I've indicated repeatedly in my DU writings, somewhat obsessively I keep spreadsheets of the of the daily, weekly, monthly and annual data at the Mauna Loa Carbon Dioxide Observatory, which I use to do calculations to record the dying of our atmosphere, a triumph of fear, dogma and ignorance that did not have to be, but nonetheless is, a fact.
Facts matter.
When writing these depressing repeating posts about new records being set, reminiscent, over the years, to the ticking of a clock at a deathwatch, I often repeat some of the language from a previous post on this awful series, as I am doing here with some modifications. It saves time.
Here's a recent post referring to weekly data:
A New Record Concentration for CO2, 426.35 ppm Has Been Set at the Mauna Loa CO2 Observatory.
Yesterday in another post I noted that March 2024 was the absolute worst month ever recorded with respect to increases over the previous year's average readings:
March 2024 Was the Worst Month Ever for CO2 Increases Measured at the Mauna Loa CO2 Observatory.
April 2024 is not likely to break the all time record for a monthly average (4.16 ppm higher) when comparing the averages of 2015 with 2016, but then again, it won't be pretty.
We now have the highest concentration ever recorded for a weekly average reading at the Observatory:
Week beginning on April 21, 2024: 427.94 ppm
Weekly value from 1 year ago: 423.96 ppm
Weekly value from 10 years ago: 401.62 ppm
Last updated: April 28, 2024
Weekly average CO2 at Mauna Loa
We have now completed the 16th week of 2024.
The increase over week 16 of 2023 is 3.98 ppm. It is the 28th highest such comparator out of 2517 such data points.
I've been at this for a long time, and I've never seen anything quite like the beginning of 2024, and the shock continues week after week of this year.
Of the top 50 highest readings of the difference between weeks of the year with those of the previous year out of the 2517 such data points, 16 have taken place in the last 5 years of which 8 occurred in 2024, 36 in the last 10 years, and 44 in this century. Of the six readings from the 20th century, four occurred in 1998, when huge stretches of the Malaysian and Indonesian rainforests caught fire when slash and burn fires designed to add palm oil plantations to satisfy the demand for "renewable" biodiesel for German cars and trucks as part of their "renewable energy portfolio" went out of control.
Week 5 (5.75 ppm higher than week 5 of 2023), week 7( 5.53 ppm higher than week 7 of 2023) , and week 10 (5.66 ppm higher than week 10 of 2023,) represent three of only four such week to week comparators with readings of the previous year to exceed a 5.00 ppm increase. The only other such an increase to exceed 5.00 ppm occurred in 2016, the previous "worst year ever" in CO2 accumulations, 5.04 ppm recorded in the week beginning July 31, 2016, week 28 when compared with week 28 of 2015.
The year is still young.
One of the other two readings of the 20th century, those not in 1998, to appear in the list of the 50 worst such increases is now the 49th highest, 3.79 ppm recorded during the week beginning 1/24/1999. The other reading from the 20th century to appear in the top 50 comparators with that of the previous year beginning 8/21/1988, (3.91 ppm over the same week of 1987, week 34) was the worst such week ever for ten years, until 1998. It is now the 32nd worst such week ever recorded.
Since the first week of the year 2000, the week beginning January 2 of that year, the increase in the concentration of the dangerous fossil fuel waste carbon dioxide in the collapsing planetary atmosphere has been 57.65 ppm.
Since I joined DU in late November 2022, the week beginning November 17, 2002, when, then as now, the main issue on my mind is the relationship between energy and the environment, the increase in the concentration of the dangerous fossil fuel waste CO2 has been 55.26 ppm. During the whole time I've been here, advocating for the use of nuclear energy to provide the bulk of the world's energy demand, I've been hearing from delusional fool after delusional fool, that we don't need nuclear energy because so called "renewable energy" is so great.
The expensive, land and mass intensive, and thus environmentally odious, fad for throwing trillions upon trillions of dollars in this century at so called "renewable energy" has done nothing other than to entrench the use of dangerous fossil fuels and to accelerate the accumulation of the dangerous fossil fuel waste carbon dioxide in the atmosphere: I keep a 52 week running average of comparators between the reading of a current week with that of 10 years previous. As of this morning, that average is 24.91 ppm/10 years, the highest such average ever observed. In 2000, when antinuke rhetoric was embraced world wide in favor the reactionary return to the early19th century dependence on the weather for energy, which is what so called "renewable energy" is, that average was 15.21 ppm/10 years.
The ten year comparator between week 16 of 2024 and week 16 of 2014 shows that 2024's reading is 26.32 ppm higher than that of 2014. This is the 6th highest 10 year comparator ever observed. Of the top 50 such 10 year comparators, all have taken place since 2016. This year, 2024, has produced 9 of those readings in the top fifty, 2023 produced another 8.
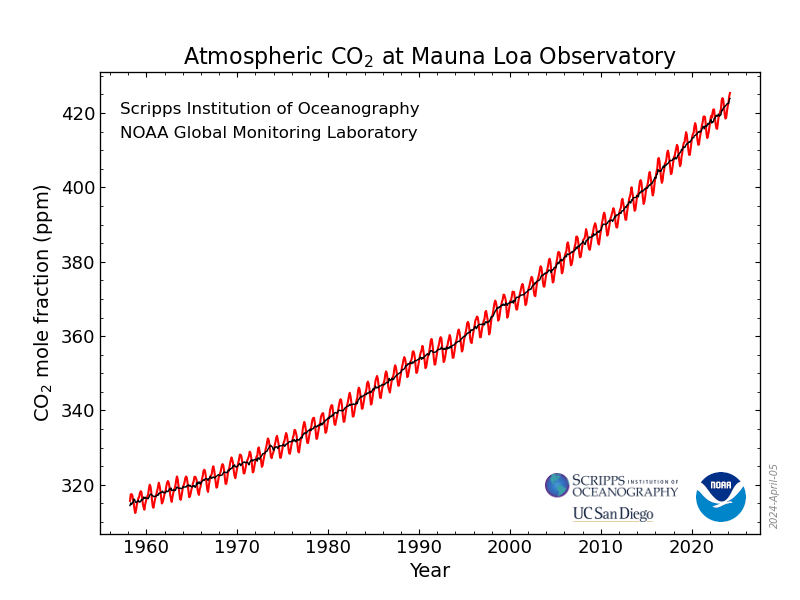
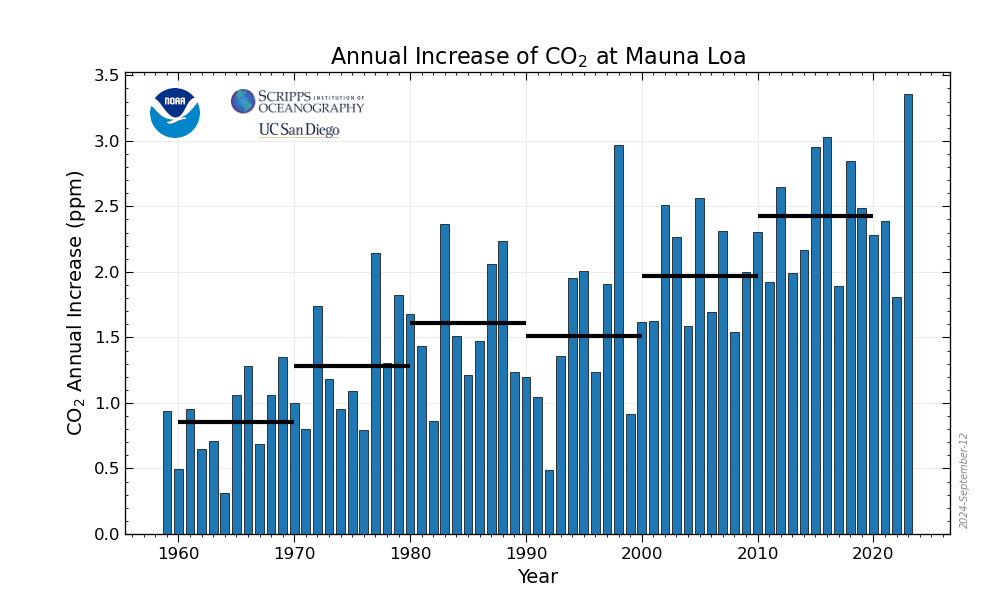
Using the rate of change of the rate of change (the 2nd derivative) of 10 year of average 52 week comparators, one can produce a second degree differential equation and using very simple calculus, integrate twice with respect to time, utilize the data for a current week as boundary conditions, and derive a simple quadratic equation as a crude model to make predictions of what the concentration is likely to be in following years. I justify this by stating that if one looks, one can see that the rate of accumulation is a sine wave superimposed on a quadratic axis:

Monthly Average Mauna Loa CO2
Solving this equation for the date that we will reach 500 ppm, using the data of week 16 of 2024 for the boundary conditions, one can see that if we do nothing to address climate change other than chant dogma about so called "renewable energy," the model predicts 500 ppm will be reached in the spring of 2046.
We hear all the time "by such and such year" soothsaying predictions about when the renewable energy nirvana will break out; I contend, and won't be dissuaded, it won't break out at all. When I was a young man it was "by 2000." It didn't happen. Now that I'm an old man, it's sometimes "by 2050." It won't happen. The model, based on data, not mindless soothsaying about how what's not working will work, predicts that "by 2050" the concentration of the dangerous and deadly fossil fuel waste CO2 will be around 520 ppm, nearly 90 ppm higher than it is now.
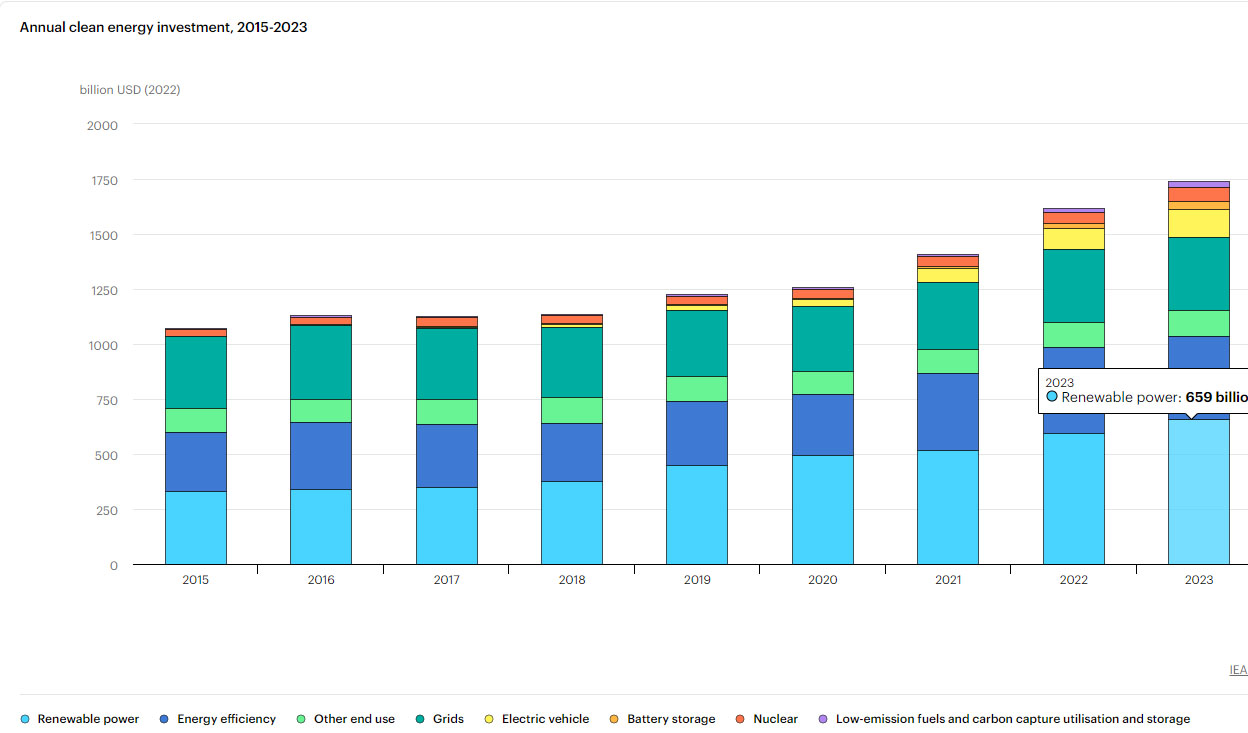
The amount of money spent on so called "renewable energy" since 2015 is 4.12 trillion dollars, compared to 377 billion dollars spent on nuclear energy, mostly to keep vapid cultists spouting fear and ignorance from destroying the valuable nuclear infrastructure.

IEA overview, Energy Investments.
The graphic is interactive at the link; one can calculate overall expenditures on what the IEA dubiously calls "clean energy."
Solar and wind, in an atmosphere of wild and insipid chanting, with wide world scale destruction of wilderness to accommodate industrial parks for them, produce slightly half what nuclear energy produces in an atmosphere of vituperation.
Destroying nuclear infrastructure is said in this scientific paper to kill people, mostly poor people:
Nuclear power generation phase-outs redistribute US air quality and climate-related mortality risk. Nat Energy 8, 492–503 (2023).
You can hear all the time from bourgeois cultists that so called "renewable energy" is cheap. It isn't cheap; it's unbelievably expensive, because it diverts resources from doing something realistic about climate change. Climate change is not cheap. It's incredibly expensive, unsustainably expensive. It's wholesale destruction of infrastructure will leave the world impoverished.
The antinukes won, and humanity, and the planet as a whole, lost.
Have a pleasant Sunday.
Barry Markson
(280 posts)To the CO2 readings from the record drought and temperature charts and graphs from the dust bowl 1930's, some of which still stand today, to better establish the correlation.
BootinUp
(51,055 posts)Going in the wrong direction

BootinUp
(51,055 posts)like we are hedging our bets as a collective strategy. And while it is mostly a gut feeling, I think more people are starting to see it your way. I expect nuclear will receive an increasing share of investment going forward.
NNadir
(37,629 posts)...it is certain to come in under the rubric of "too little, too late." I've played with these numbers to see what might have been, were it not for the triumph of fear and ignorance, but will save discussion to an independent post.
To steal a line from the snake oil selling antinuke fool Amory Lovins... It's the "road not traveled," the one that he, a functional idiot, contributed to closing off at least in the United States. It strikes me as incredible that someone who has been wrong about so many things is still treated with respect.
The numbers cited in the OP for carbon dioxide concentrations are unbelievable, and still, still, still, we have people who consider them trivial compared to idiot obsessions with Fukushima and Chernobyl, which they incredibly define as the only unacceptable energy disasters ever. They're idiots. Air pollution and climate change are seven to eight orders of magnitude, even more dependent on how you look at it, worse than the obsessions idiots carry around proudly.
