Welcome to DU! The truly grassroots left-of-center political community where regular people, not algorithms, drive the discussions and set the standards. Join the community: Create a free account Support DU (and get rid of ads!): Become a Star Member Latest Breaking News Editorials & Other Articles General Discussion The DU Lounge All Forums Issue Forums Culture Forums Alliance Forums Region Forums Support Forums Help & Search

progree

(12,097 posts)
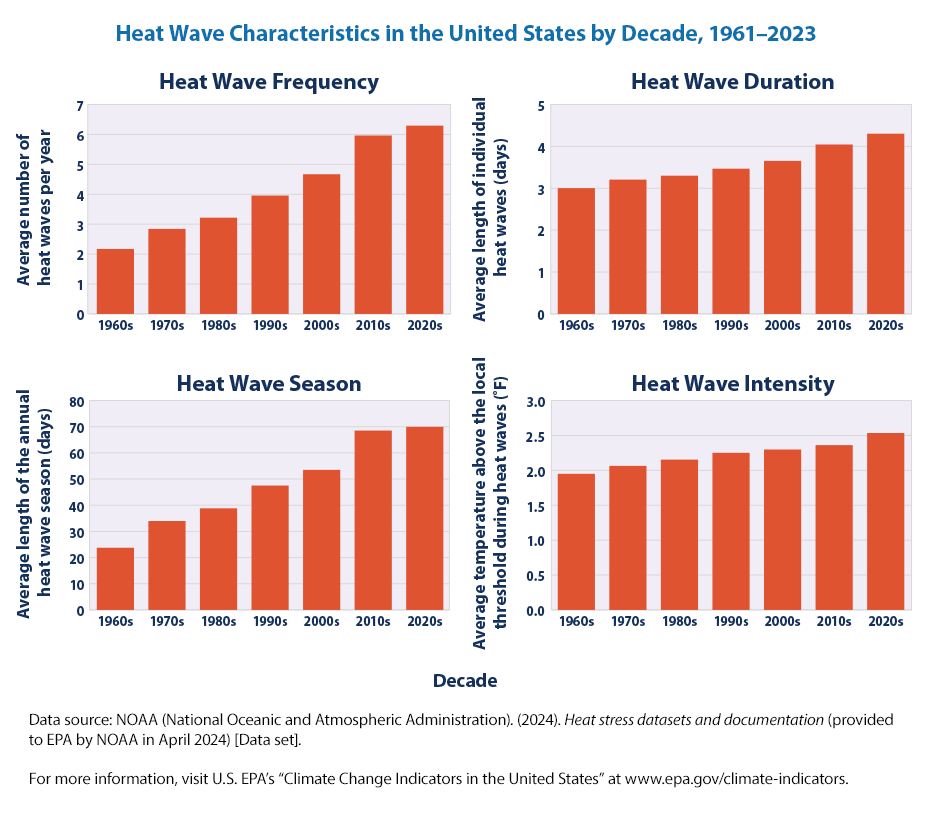
5. Heat Waves - decade by decade from the 1960's on - 4 bar charts: Heat Wave Frequency, Heat Wave Duration, ...
Wed Jul 10, 2024, 02:21 PM
Jul 2024


https://www.epa.gov/climate-indicators/climate-change-indicators-heat-waves

Thanks OKIsItJustMe : https://www.democraticunderground.com/1127174794

=================================================

How a small rightward shift in the average daily high temperature produces a huge increase in the frequency of very hot days:
e.g. a 2% increase in the July average daily high in a locale with a July average daily high of 85 degrees (e.g. New York City) produces a 2.44 fold increase (144% increase) in the number of 103+ degree July days.
https://www.democraticunderground.com/10143266574#post1

Recommendations

0 members have recommended this reply (displayed in chronological order):

Latest Discussions»Latest Breaking News»This June was the 2nd-hot...»Reply #5