Welcome to DU!
The truly grassroots left-of-center political community where regular people, not algorithms, drive the discussions and set the standards.
Join the community:
Create a free account
Support DU (and get rid of ads!):
Become a Star Member
Latest Breaking News
Editorials & Other Articles
General Discussion
The DU Lounge
All Forums
Issue Forums
Culture Forums
Alliance Forums
Region Forums
Support Forums
Help & Search
Economy
In reply to the discussion: WEE December 4, 2015 I'll start......I'll start with some...... [View all]Proserpina
(2,352 posts)37. Commodity prices and exchange rates
http://econbrowser.com/archives/2015/11/commodity-prices-and-exchange-rates
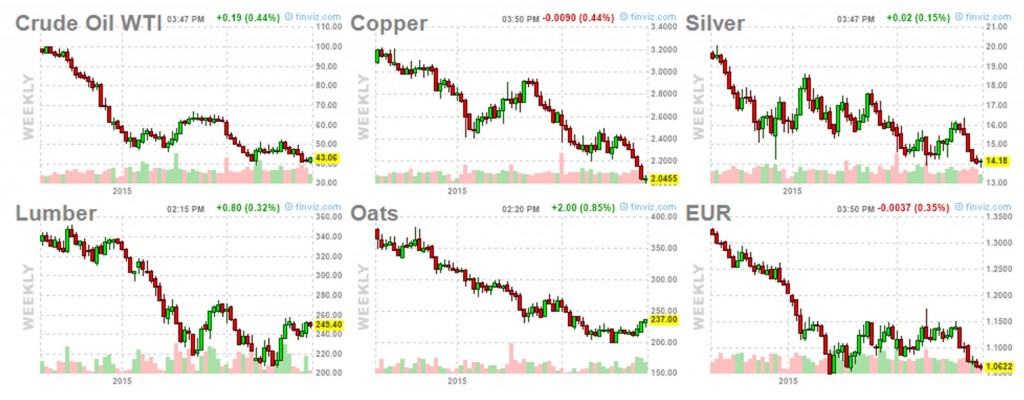
The dramatic decline in the prices of a number of commodities over the last 16 months must have a common factor. One variable that seems to be quite important is the exchange rate. Here’s a graph over a longer period of the dollar price of oil, the dollar price of copper, and the dollar price of a weighted average of other countries’ currencies with weights based on the volume of trade between the U.S. and each country. The graph is plotted on a logarithmic basis, so for small changes the height of each series corresponds to the percent difference between the price at the indicated date and the price at the end of June 2014 (see my primer on the use of logarithms in economics if you’re curious about those statements or why it might be helpful to plot series this way). The plunge down in all three measures since June 2014 that was highlighted in the first set of graphs is seen to be a broader pattern of striking positive co-movements among these variables.
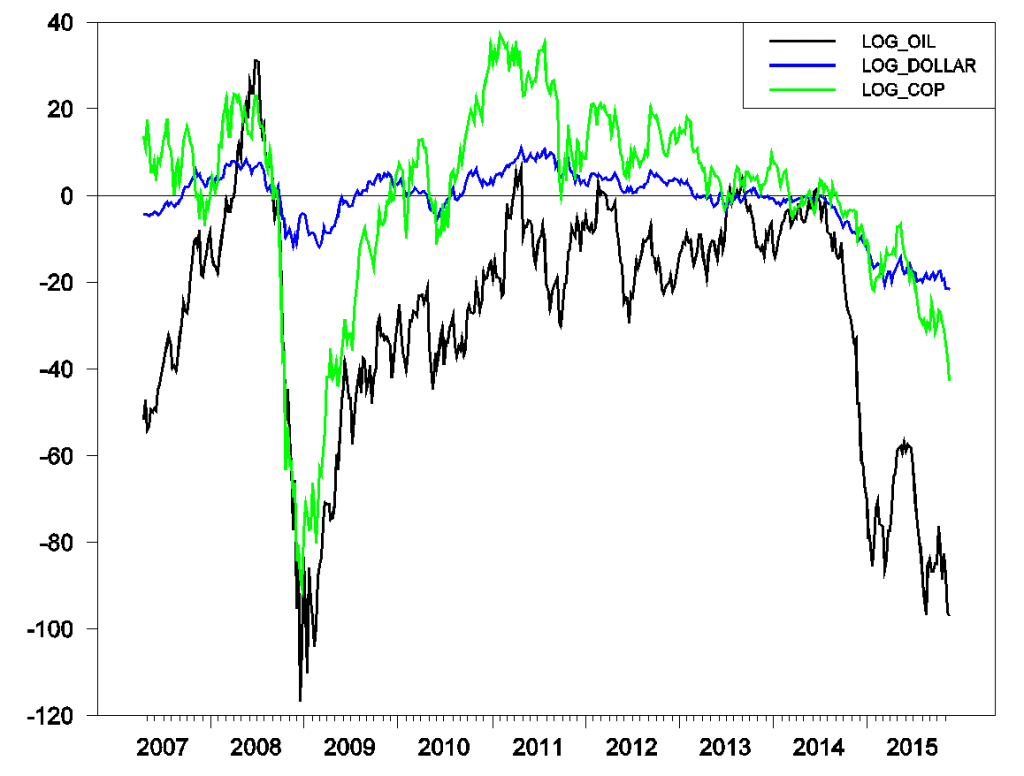
One would expect that when the dollar price of other countries’ currencies falls, so would the dollar price of internationally traded commodities. But it is a mistake to say that the exchange rate is the cause of the change in commodity prices. The reason is that exchange rates and commodity prices are jointly determined as the outcome of other forces. Depending on what those other forces are, one might see stronger or weaker co-movement between commodity prices and exchange rates.
For example, the most striking episode in the graph above is the Great Recession in 2008-2009. Falling GDP around the world meant falling demand for commodities. It was also associated with a flight to safety in capital markets, which showed up as a surge in the value of the dollar. It’s not the case that the strong dollar then was the cause of falling dollar prices of oil and copper. Instead, the Great Recession was itself the common cause behind movements in all three variables...
more
The dramatic decline in the prices of a number of commodities over the last 16 months must have a common factor. One variable that seems to be quite important is the exchange rate. Here’s a graph over a longer period of the dollar price of oil, the dollar price of copper, and the dollar price of a weighted average of other countries’ currencies with weights based on the volume of trade between the U.S. and each country. The graph is plotted on a logarithmic basis, so for small changes the height of each series corresponds to the percent difference between the price at the indicated date and the price at the end of June 2014 (see my primer on the use of logarithms in economics if you’re curious about those statements or why it might be helpful to plot series this way). The plunge down in all three measures since June 2014 that was highlighted in the first set of graphs is seen to be a broader pattern of striking positive co-movements among these variables.
One would expect that when the dollar price of other countries’ currencies falls, so would the dollar price of internationally traded commodities. But it is a mistake to say that the exchange rate is the cause of the change in commodity prices. The reason is that exchange rates and commodity prices are jointly determined as the outcome of other forces. Depending on what those other forces are, one might see stronger or weaker co-movement between commodity prices and exchange rates.
For example, the most striking episode in the graph above is the Great Recession in 2008-2009. Falling GDP around the world meant falling demand for commodities. It was also associated with a flight to safety in capital markets, which showed up as a surge in the value of the dollar. It’s not the case that the strong dollar then was the cause of falling dollar prices of oil and copper. Instead, the Great Recession was itself the common cause behind movements in all three variables...
more
Edit history
Please sign in to view edit histories.
Recommendations
0 members have recommended this reply (displayed in chronological order):
63 replies
 = new reply since forum marked as read
Highlight:
NoneDon't highlight anything
5 newestHighlight 5 most recent replies
RecommendedHighlight replies with 5 or more recommendations
= new reply since forum marked as read
Highlight:
NoneDon't highlight anything
5 newestHighlight 5 most recent replies
RecommendedHighlight replies with 5 or more recommendations
= new reply since forum marked as read
Highlight:
NoneDon't highlight anything
5 newestHighlight 5 most recent replies
RecommendedHighlight replies with 5 or more recommendations
I can't believe she got a time out for posting a legitimate article from a legitimate source.
mother earth
Dec 2015
#19
Unlike mainstream prognosticators, who seem to always find a silver lining. Or 100...
MattSh
Dec 2015
#7
Closing the 'Collapse Gap': the USSR was better prepared for collapse than the US
MattSh
Dec 2015
#9
The Countries With The Highest Levels Of Poverty For Retirees [Infographic] - Forbes
MattSh
Dec 2015
#11
The Federal Reserve Board's 8 Percent Hike in the Social Security Tax / Dean Baker
Proserpina
Dec 2015
#38