Gun Control & RKBA
Showing Original Post only (View all)30 years of gun sales, or graphics showing gun control effort's unintended consequences [View all]
Last edited Mon Apr 5, 2021, 10:00 PM - Edit history (3)
A couple of months ago, when I had some free time, I dipped a toe into some of the BATFE's sales data on guns. Today, having lots of free time (avoiding the shopping frenzy and distracting myself from some personal issues) I went deeper into the ATF's data and crunched some numbers. I subtracted exports and added imports, and got a slightly newer version of the report (data goes to 2015, not 2013).
The sales numbers are from here:
Report database: https://www.atf.gov/resource-center/data-statistics
Direct link to the PDF: https://www.atf.gov/resource-center/docs/undefined/firearms-commerce-united-states-annual-statistical-update-2017/download
You can view my spreadsheet as either an Excel...
http://www.krispos42.com/Gungeon/ATF-gun-sales-1986-2015.xls
...or in the original OpenOffice Calc:
http://www.krispos42.com/Gungeon/ATF-gun-sales-1986-2015.ods
Note that I removed (and corrected for) the miscellaneous firearms category.
My original intent was to see how gun sales looked, corrected for population growth. The following charts are derived from that per-capita data. Feel free to save them, re-host them, or link to them.
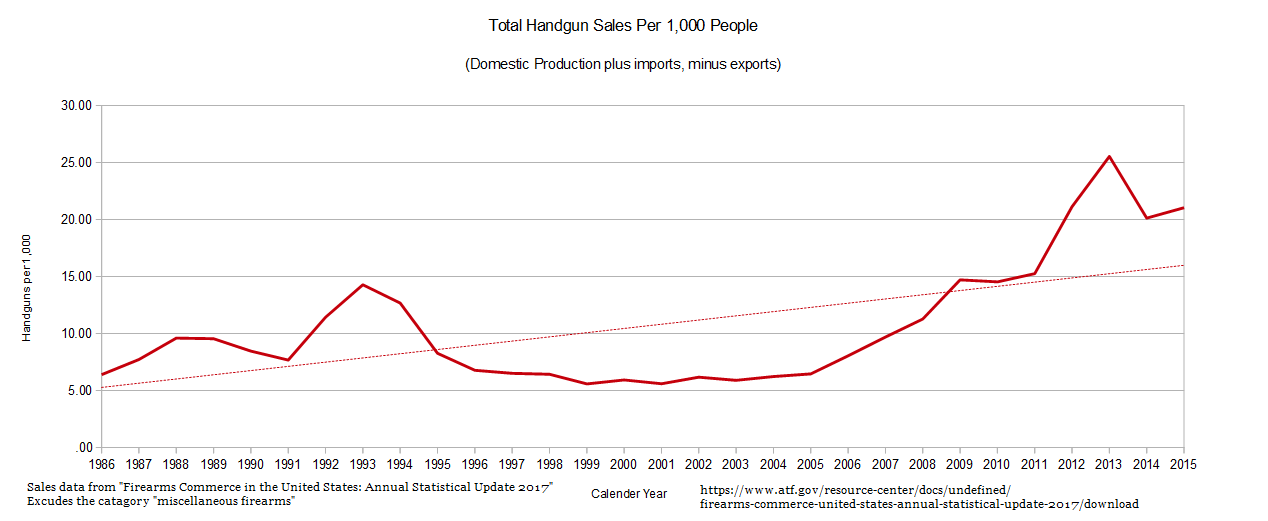
First: here is the totals. This is sales per 1,000 people, with a trend line.
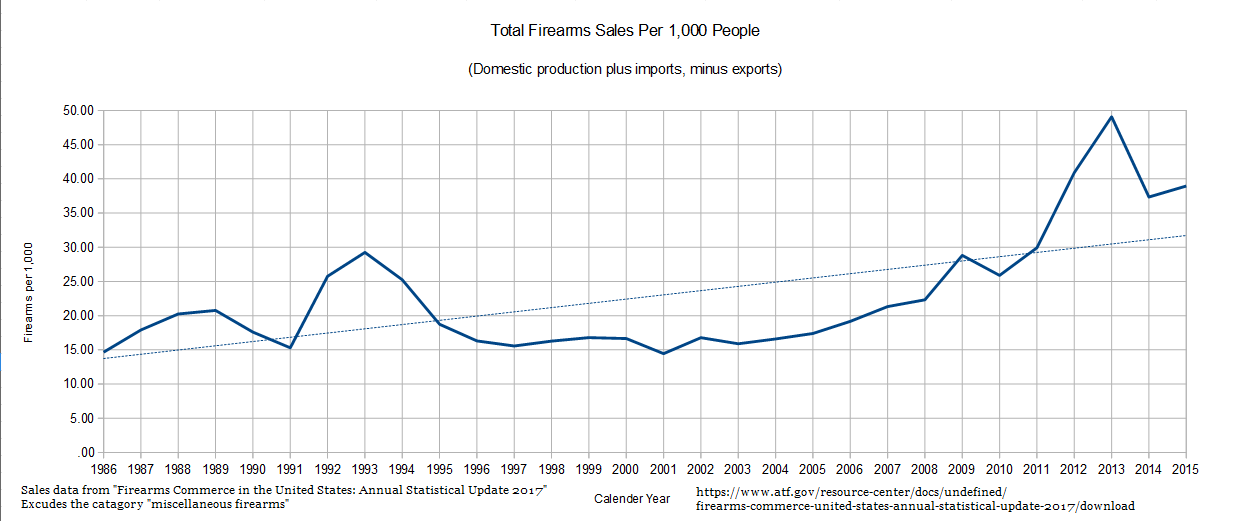
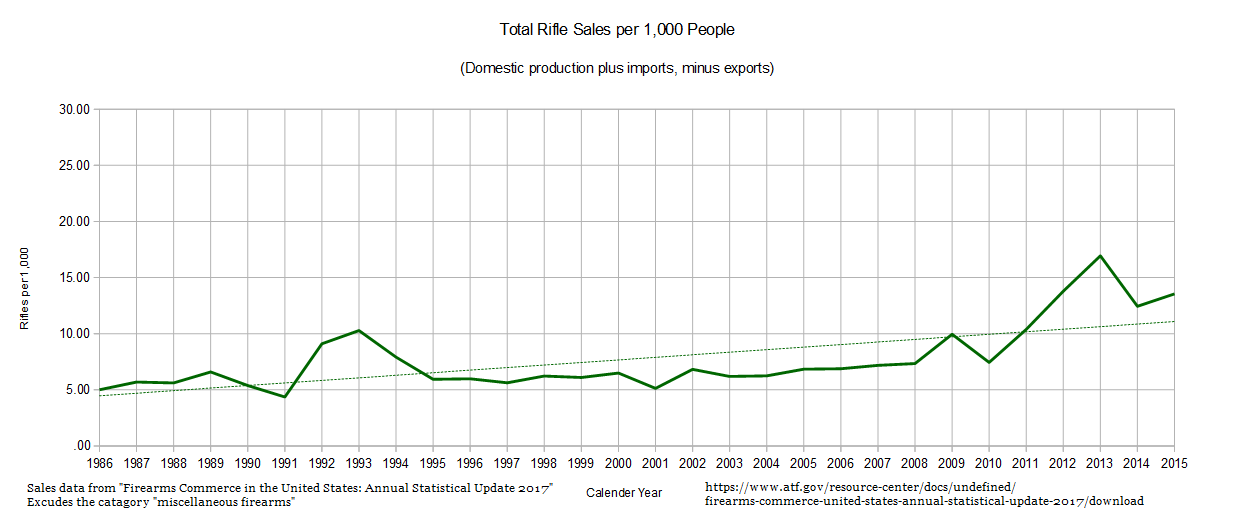
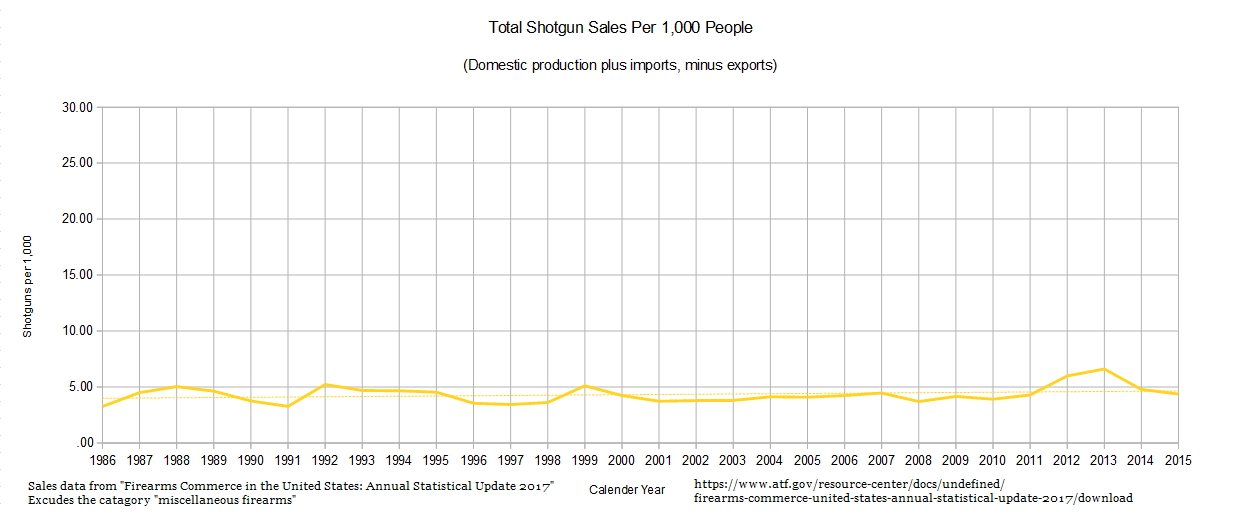
As you can see the exploding sales of handguns and rifles drive most of the increase; shotgun sales remain relatively flat.
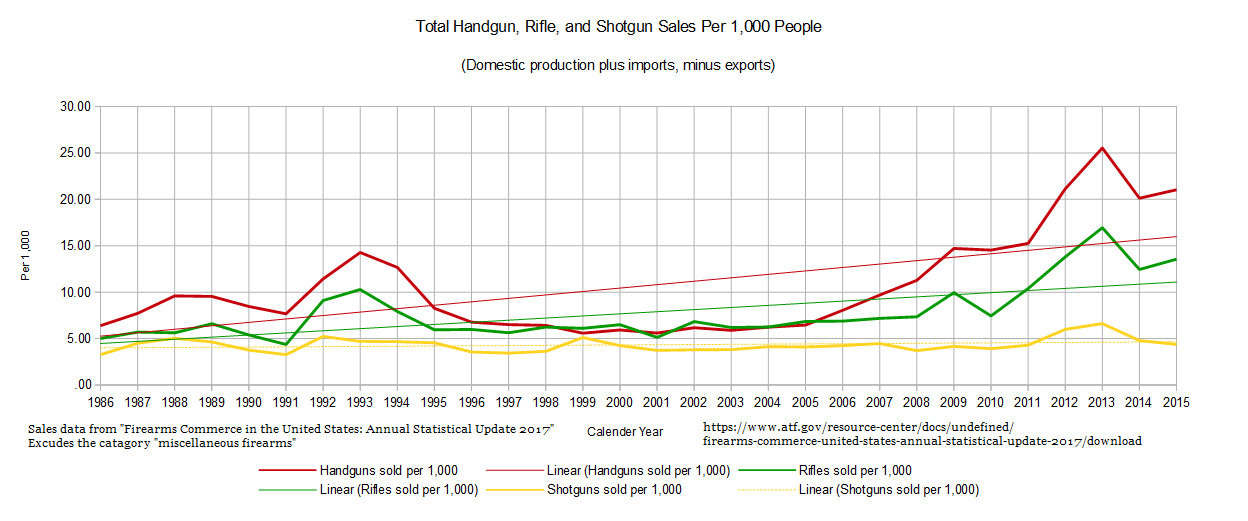
I'll let the reader speculate as to the rifle sales surge. Handgun sales are of course related to the liberalization of concealed-carry laws, as shown:
But what was really interesting was per capita sales relative to 1986. In other works, 1986 is "0" on this chart.
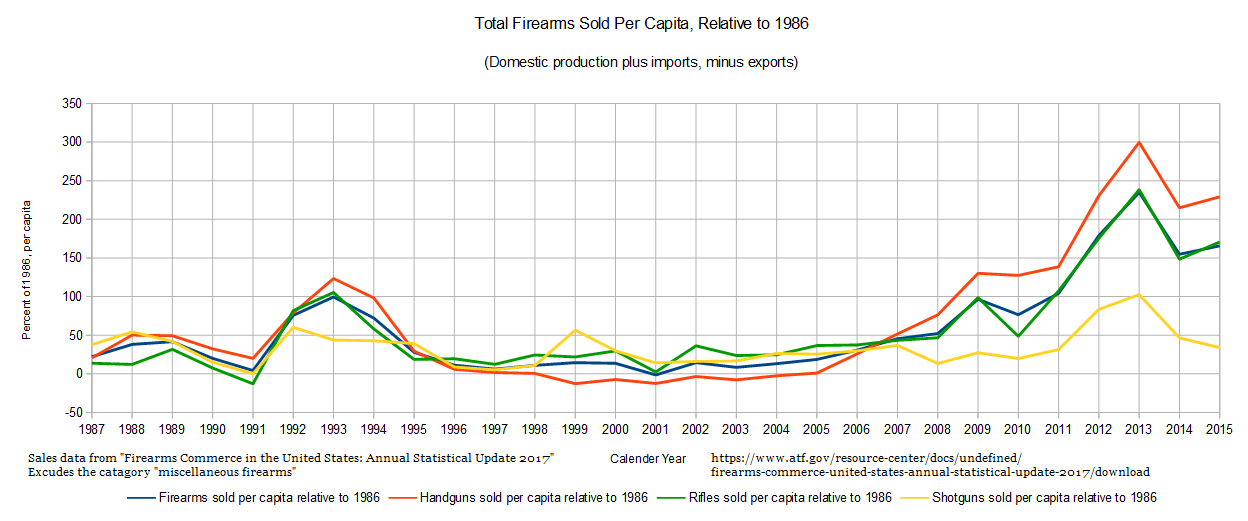
In 1986, 1,000 people purchased (on average) 14.66 guns. In 2015, those same 1,000 people bought 38.95! The peak was 2013, at 49.08. In fact, only one year (2001) has the number dip below 1986's rate, and only by 1.5% (14.45 guns per 1,000 people).
So, given the information presented, how can we judge the various efforts by various organizations on this issue? What is working, and what isn't? If the goal is X, is effort Y bringing us closer or further to X?
Here are stand-alone charts for handguns, rifles, and shotguns. I put them to the same scale for apples-to-apples visual comparison.
 = new reply since forum marked as read
Highlight:
NoneDon't highlight anything
5 newestHighlight 5 most recent replies
= new reply since forum marked as read
Highlight:
NoneDon't highlight anything
5 newestHighlight 5 most recent replies