OKIsItJustMe
OKIsItJustMe's JournalIntegrating indirect greenhouse gases into climate frameworks (about 15% of warming caused by largely ignored sources)
https://www.sparkclimate.org/explainers/indirect-greenhouse-gases.html…
What are indirect greenhouse gases?
Indirect greenhouse gases have minimal direct climate effects, but they trigger chemical reactions in the atmosphere that can increase greenhouse gas concentrations — especially ozone and methane.
Why now?
- As we decarbonize fossil fuels, some indirect greenhouse gases emissions may actually increase — for example, leaks from hydrogen infrastructure. Accounting for these effects is critical to avoiding unintended climate consequences.
- Indirect greenhouse gases increase tropospheric ozone, a deadly air pollutant linked to hundreds of thousands of premature deaths each year. Reducing these emissions would save lives and reduce warming.
Where do indirect greenhouse gases come from?
Human activities have considerably increased indirect greenhouse gas emissions beyond natural levels. Natural sources can also be perturbed by land use change, climate change, and rising carbon dioxide levels.
…
Major climate report shows Earth is getting hotter faster
https://www.leeds.ac.uk/news/article/5977/major-climate-report-shows-earth-is-getting-hotter-fasterHuman activities pushed global warming to 1.37°C in 2025, and its level is projected to surpass 1.5°C in about four years. Crucially, the rate at which heat is accumulating in the Earth system suggests high levels of future warming.
These are some of the key findings from the latest Indicators of Global Climate Change (IGCC) report, published today in Earth System Science Data.
An international team of more than 70 scientists, including IPCC Lead Authors, Contributing Authors, and Chapter Scientists, from 56 institutions across 17 countries contributed to this year’s IGCC study.
Professor Piers Forster, Director of the Priestley Centre for Climate Futures at the University of Leeds and lead author, said: “A key indicator is the Earth's energy imbalance, which measures how fast heat is accumulating in the climate system, and provides a crucial measure of the pace of climate change. Without human influence, it should be close to zero, but it has been growing since the 1970s and is now at a record high, doubling in recent decades.”
…
The Truth about Government funding for Energy Research over the years
Over and over, we hear about how “Nuclear Energy” just wasn’t given the federal research funding it deserved. 
Now (don’t get me wrong) I like a good fairy tale just as much as the next person, but, let’s be honest.
https://www.congress.gov/crs_external_products/RS/PDF/RS22858/RS22858.17.pdf
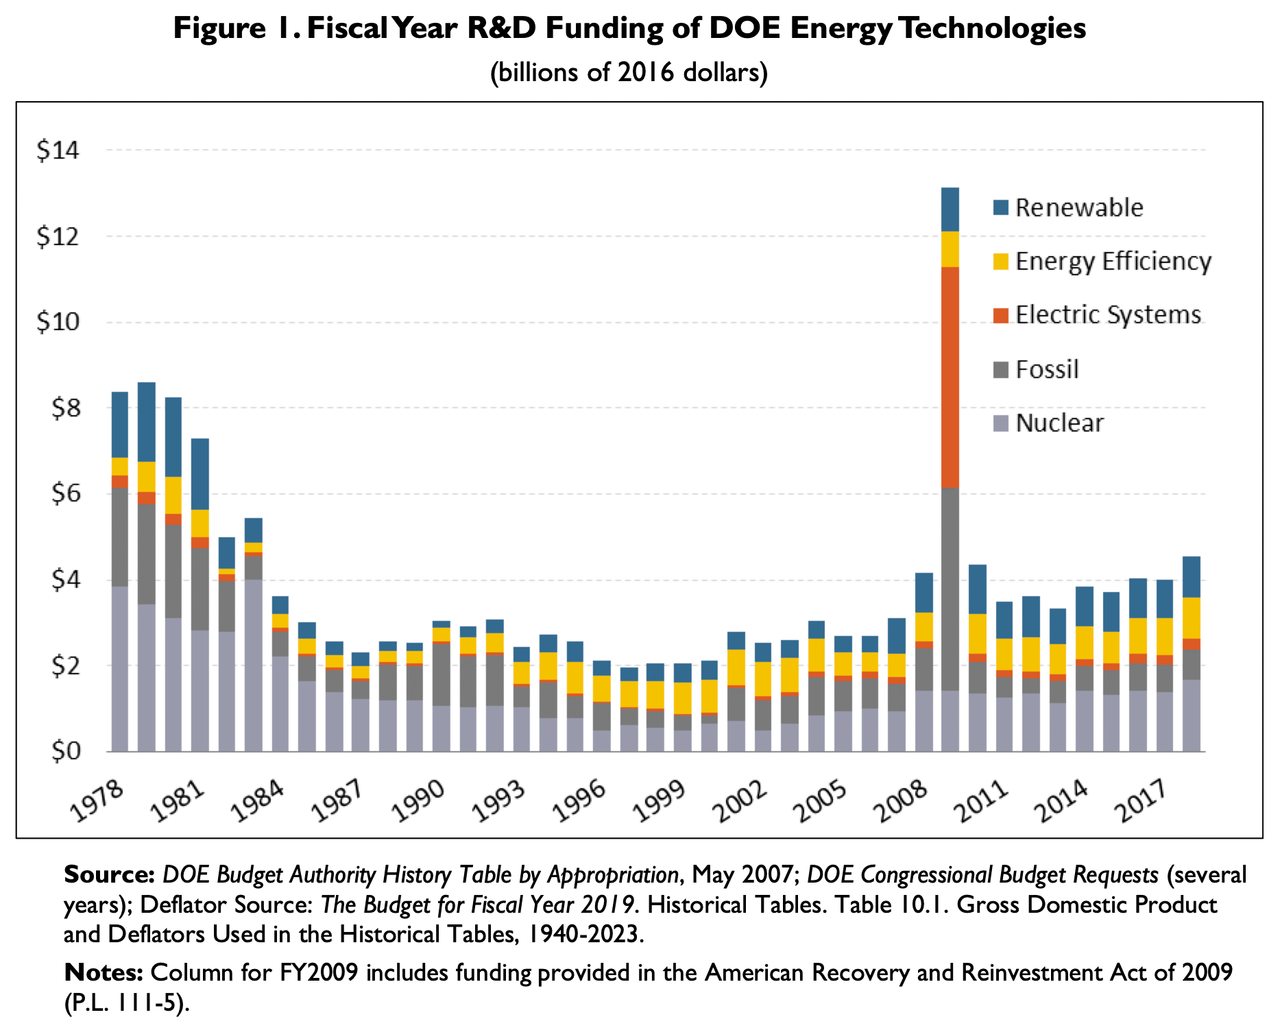
Renewable Energy R&D Funding History: A Comparison with Funding for Nuclear Energy, Fossil Energy, Energy Efficiency, and Electric Systems R&D
Updated June 18, 2018
Summary
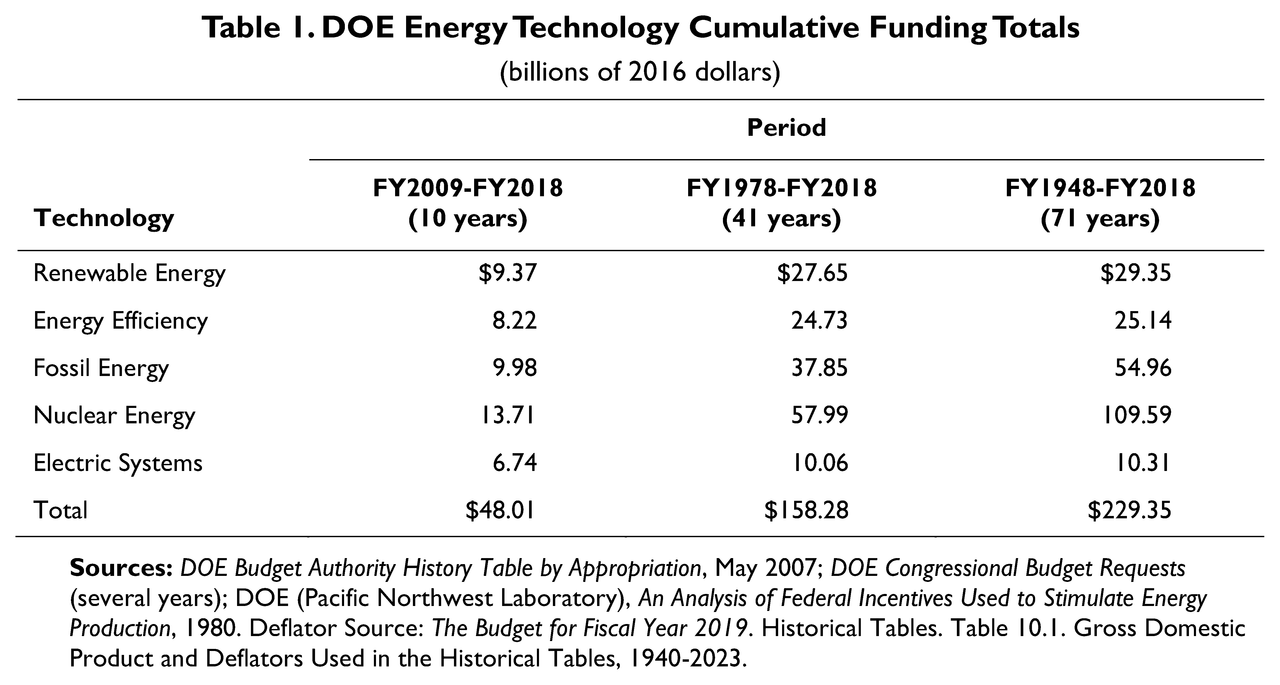
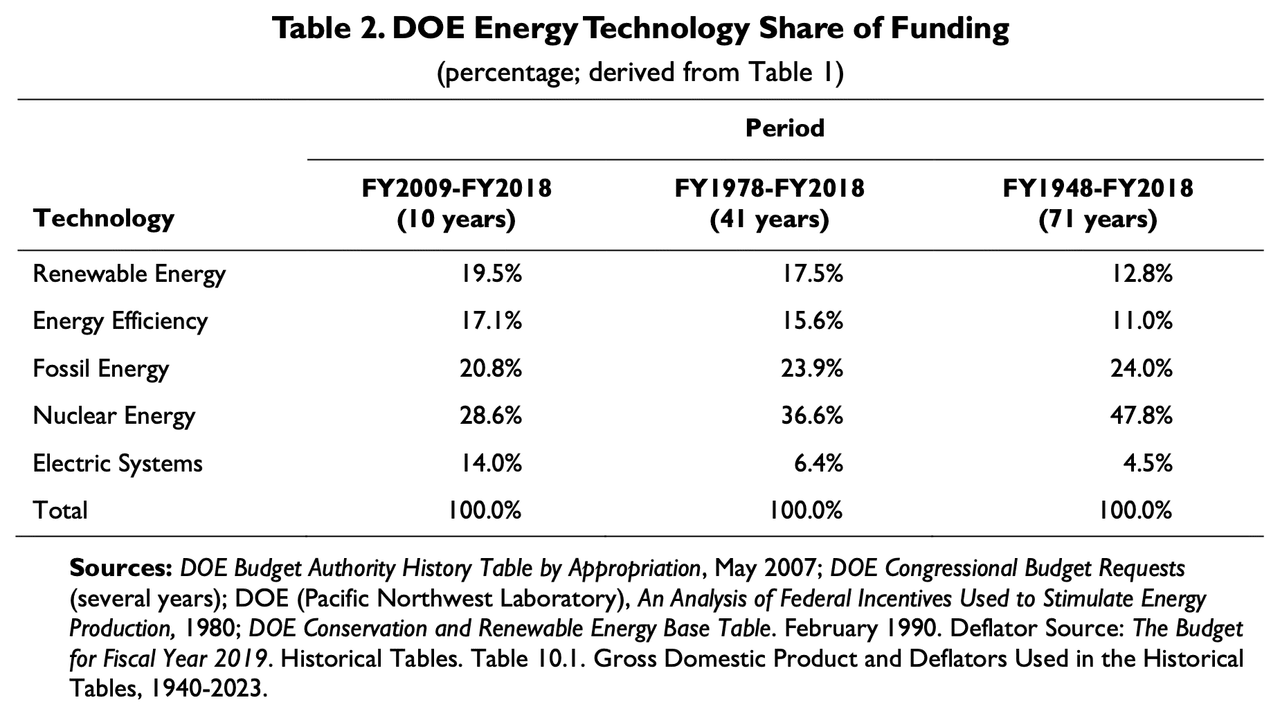
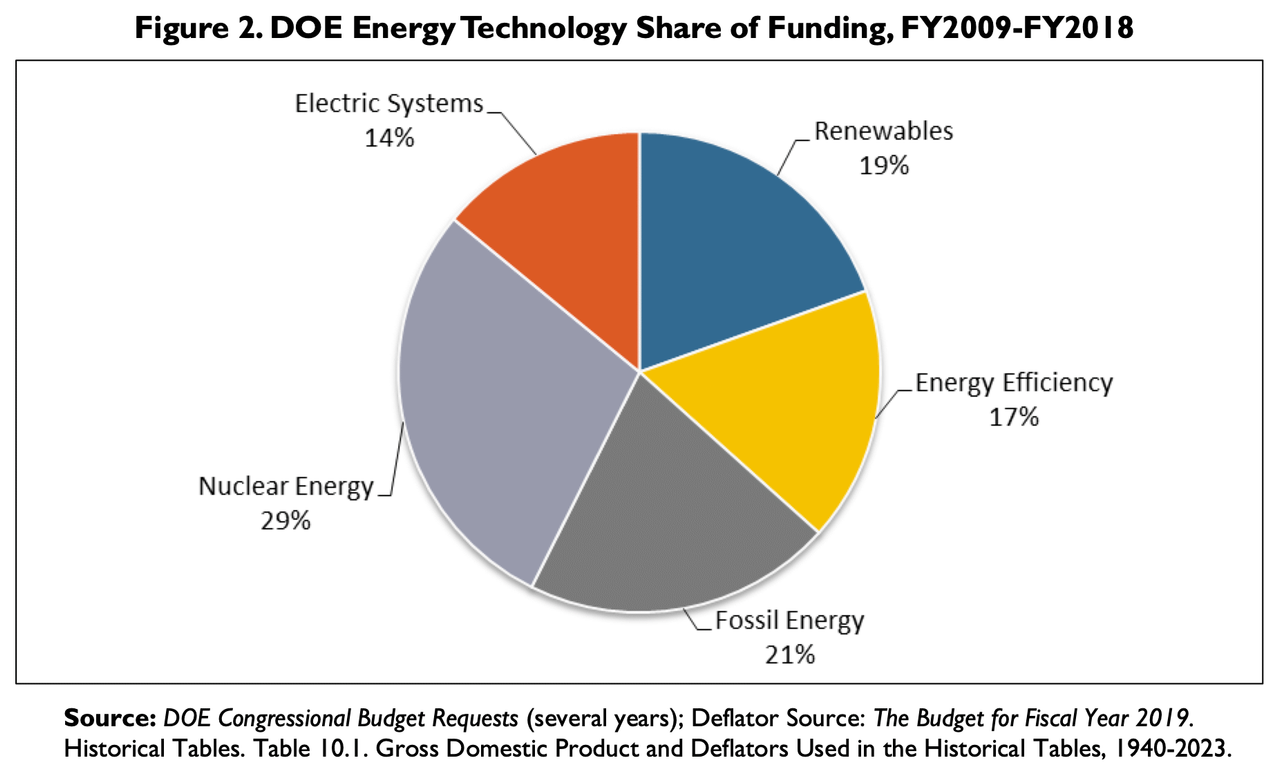
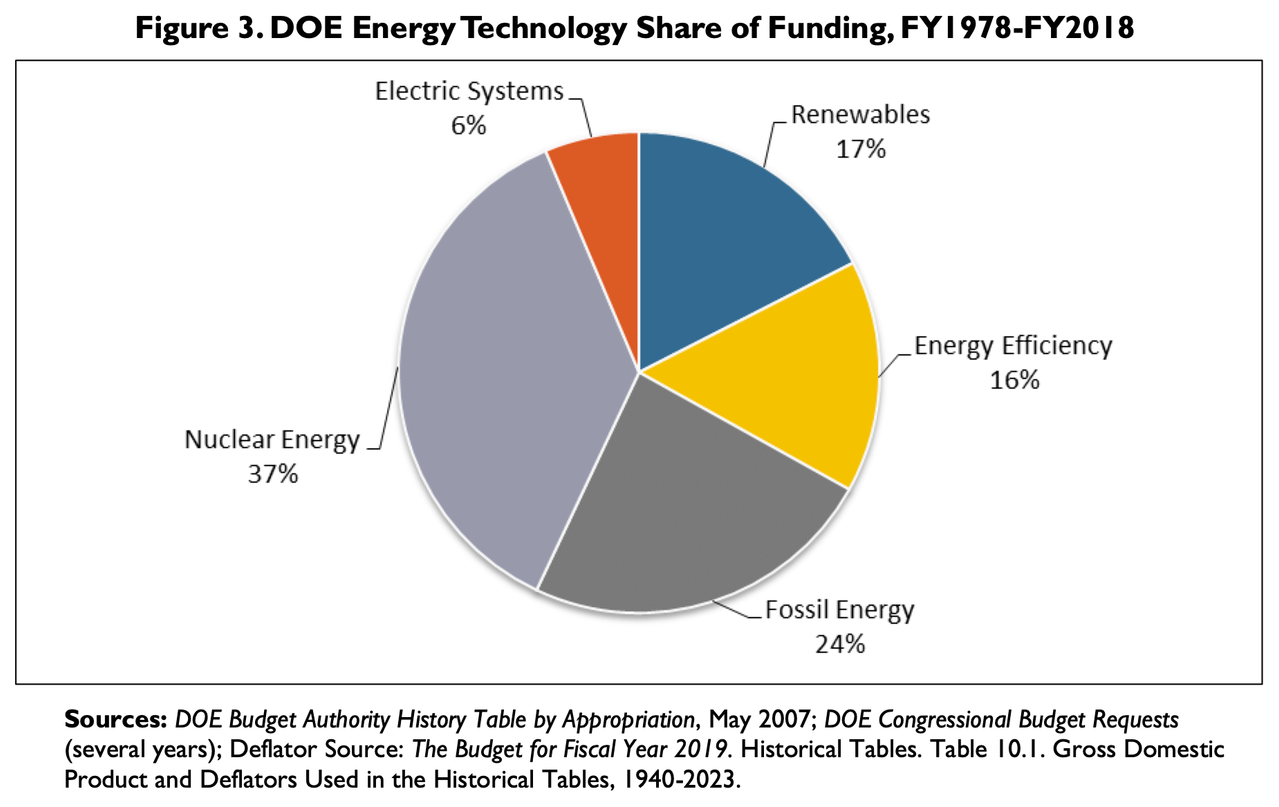
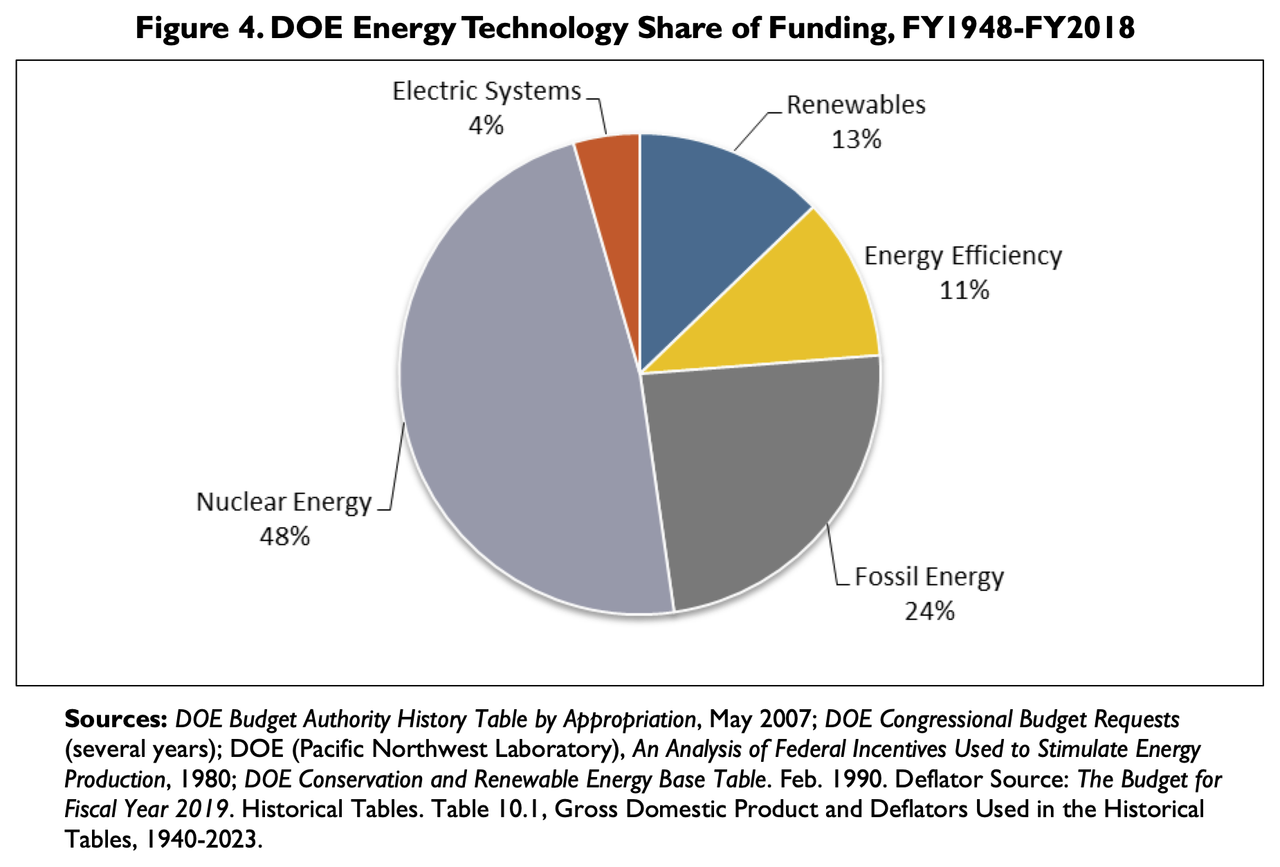
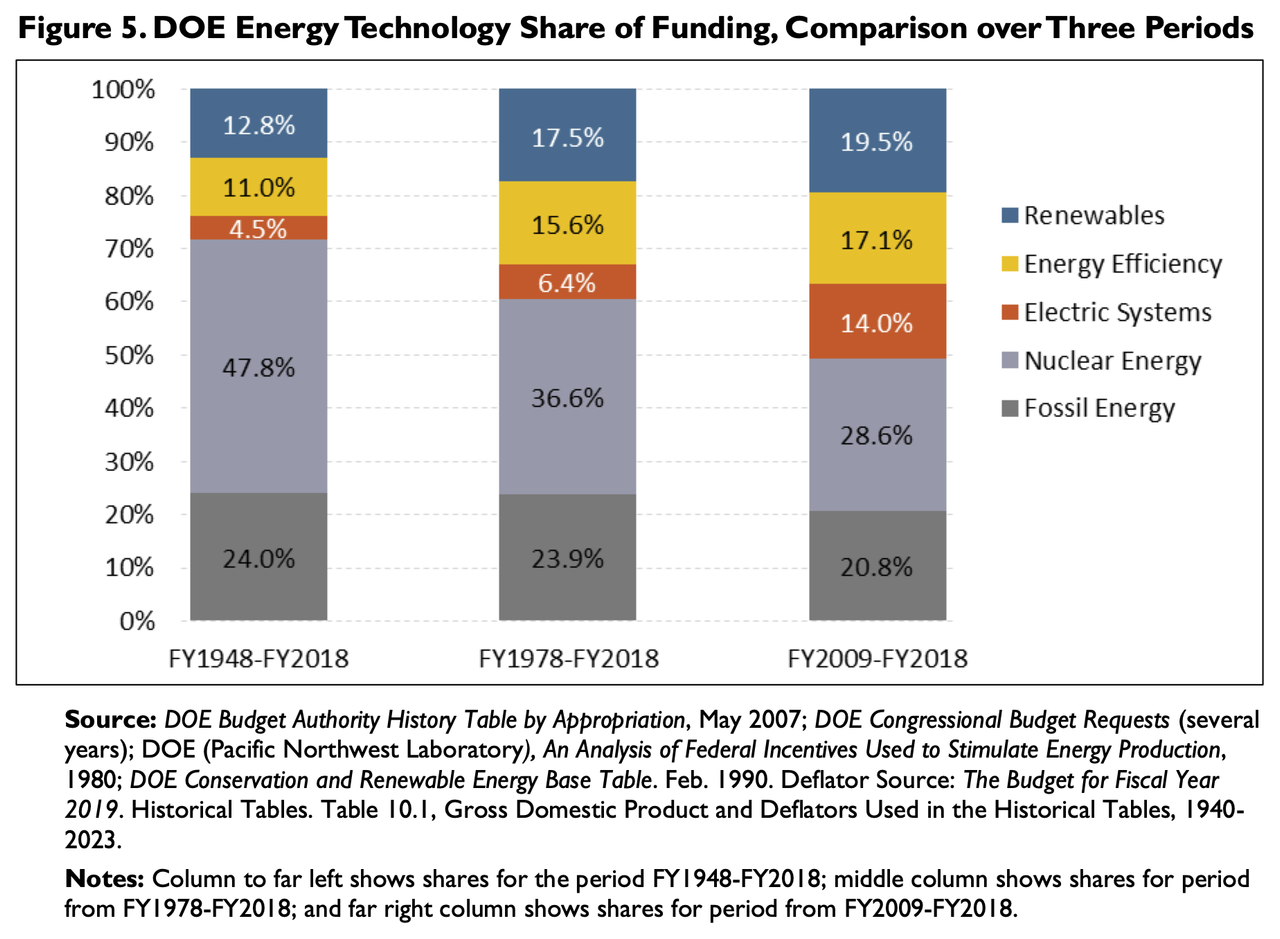
Energy-related research and development (R&D)—on coal-based synthetic petroleum and on atomic bombs—played an important role in the successful outcome of World War II. In the postwar era, the federal government conducted R&D on fossil and nuclear energy sources to support peacetime economic growth. The energy crises of the 1970s spurred the government to broaden the focus to include renewable energy and energy efficiency. Over the 41-year period from the Department of Energy’s (DOE’s) inception at the beginning of FY1978 through FY2018, federal funding for renewable energy R&D amounted to about 18% of the energy R&D total, compared with 6% for electric systems, 16% for energy efficiency, 24% for fossil, and 37% for nuclear. For the 71-year period from 1948 through 2018, nearly 13% went to renewables, compared with nearly 5% for electric systems, 11% for energy efficiency, 24% for fossil, and 48% for nuclear.
…
…
Rising Emissions, Depleting Water and Vanishing Land--UN Scientists: AI Is Threatening Natural Resources for Billions
https://unu.edu/inweh/news/environmental-cost-of-AIs-Enrgy-use-carbon-water-and-land-footprintsDate Published 3 Jun 2026
Richmond Hill, Ontario, Canada (3 June 2026) – By 2030, the global data centres powering artificial intelligence are projected to consume 945 terawatt-hours of electricity. This is nearly triple the combined annual electricity use of Pakistan, Bangladesh, and Nigeria—countries collectively home to more than 650 million people. Their associated water footprint will equal the basic annual domestic water needs of all 1.3 billion people in Sub-Saharan Africa, and their land footprint will exceed 14,500 square kilometers, roughly twice the Jakarta metropolitan area, home to more than 32 million people.
These stark findings are detailed in the new report, Environmental Cost of AI's Energy Use: Carbon, Water and Land Footprints, by the United Nations University Institute for Water, Environment and Health (UNU-INWEH). Researchers have previously warned about the greenhouse gas emissions of data centers before. But the UN scientists now argue that the environmental costs of AI and data centers cannot be understood through carbon emissions alone. In their report, they quantify the carbon, water and land footprints of AI's electricity use across the globe and highlight the big differences between these footprints in the world’s 20 largest data center hubs.
"This report is not a case against artificial intelligence, a technological transformation that is improving the lives of billions of people around the world," said Professor Kaveh Madani, Director of UNU-INWEH who led the investigation team. "It is a call for using it responsibly and addressing its unintended impacts proactively to make it sustainable and equitable. We have a narrow window to ensure that the backbone of the technological revolution of our era develops within planetary limits, and that the communities who provide the critical minerals for advancing AI and the ones that host its infrastructure and e-waste are also among those who benefit from it."
A footprint that is being mismeasured
The report finds that AI's environmental cost is being systematically mismeasured. Most existing assessments focus on the carbon emissions associated with training large models. Yet every kilowatt-hour of electricity used to train or run an AI system also carries a water footprint, from cooling and power generation, and a land footprint, from energy infrastructure and supply chains. These three footprints do not move in the same direction. Switching from coal to bioenergy, for example, can on average cut the carbon footprint of electricity by 70 per cent, while increasing its water footprint more than thirty-fold and its land footprint a hundred-fold. The report concludes that "low-carbon" is not automatically "low-water" or "low-land” and warns that evaluating AI sustainability through a single metric can hide trade-offs and shift environmental burdens onto regions already facing water or land stress.
…
"What surprised us most is how often the choices that look greenest from a carbon perspective end up worse for water or for land," said Dr. Miriam Aczel, UNU-INWEH Researcher and the lead author of the report. "If we keep judging AI sustainability by carbon alone, we might think that renewables make AI infrastructure clean but that is solving one problem while creating other problems, often in places that didn't ask for it."
…
IEA: Net Zero Emissions by 2050 - Acting now to limit overshoot
Please note: this is quoted from a Creative Commons source:
IEA (2025), World Energy Outlook 2025, IEA, Paris https://www.iea.org/reports/world-energy-outlook-2025, Licence: CC BY 4.0 (report); CC BY NC SA 4.0 (Annex A)
- The Paris Agreement set the global goal of limiting warming to well below 2 °C and pursuing efforts to limit it to 1.5 °C. The IEA Net Zero Emissions by 2050 (NZE) Scenario translates the 1.5 °C goal into a global pathway for the energy sector. The updated NZE Scenario presented here takes account of the most recent data and trends. Each country will tailor its own path to net zero emissions. The updated NZE Scenario is based on four central pillars that are widely applicable: clean energy electrification, energy efficiency, low-emissions fuels and methane abatement.
- The installed capacity of renewables increases nearly fourfold from today’s level by 2035 in the NZE Scenario: nuclear and other low-emissions technologies increasingly contribute as electricity demand grows to account for one-third of all energy consumption. Energy efficiency increases by about 4% per year by 2035, double the rate of 2022. Sustainable fuels – including liquid biofuels, biogases, low-emissions hydrogen and hydrogen-based fuels – are widely deployed: their use more than quadruples by 2035 from current levels. Methane emissions are cut by more than 80% by 2035.
- Global energy-related carbon dioxide (CO₂) emissions were 38 gigatonnes (Gt) in 2024. In the NZE Scenario, emissions fall by nearly 55% by 2035 to around 18 Gt. Yet, the increase in long-term global average temperature exceeds 1.5 °C around 2030 and peaks at around 1.65 °C about 2050. The NZE Scenario achieves the COP28 goals of doubling efficiency and tripling renewables capacity by 2030, and it meets the Paris Agreement goal of holding warming well below 2 °C throughout the 21st Century.
- The updated NZE Scenario reflects the fact that exceeding 1.5 °C is now inevitable, and some reliance on technologies to remove CO₂ from the atmosphere is unavoidable to return warming to below 1.5 °C. Such technologies are expensive and unproven at scale: immediate action to reduce emissions can limit the scale of the removals needed. In the NZE Scenario, the global average temperature increase falls back below 1.5 °C by 2100.
- Energy investment in the NZE Scenario increases to around USD 4.8 trillion per year over the next decade, from USD 3.3 trillion today. As these upfront investments are made, savings from lower fuel prices together with efficiency gains mean that households face costs for energy services comparable to those of today through to 2035, and lower still in the longer term. Fuel importers benefit too as import bills are cut by about two-thirds. Electricity takes on a bigger role to meet energy demand, underlining the significance of electricity security, and the need for secure and diversified supply chains for critical minerals and energy technologies.
Rapidly melting Antarctic ice shelves may cause global sea levels to rise far faster than expected - new study
https://ic3.uit.no/news/hattermann-sea-level-riseGlobal sea levels may rise faster than previously expected, a new study suggests. The reason is that warming oceans appear to be melting Antarctic ice shelves from below much more rapidly than expected.
Ice shelves, which are extensions of gigantic glaciers that float on the water surface, act like buttresses that slow the flow of gigatons of ice into the sea.
Now, researchers have discovered that long, channel-like grooves on the underside of these ice shelves can trap relatively warm ocean water. This sharply increases local melting.
The study has global implications. If Antarctic ice shelves thin and weaken, the downhill journey of the ice behind them can accelerate, fast-forwarding the process in which huge amounts of ice cascade into the ocean, causing sea levels worldwide to rise far faster than currently projected.
This dynamic has already been observed elsewhere in Antarctica. The Intergovernmental Panel on Climate Change (IPCC) has flagged polar ice shelf instability as a major but poorly understood risk factor that could lead to sea level rise that is far more rapid and severe than most current models predict.

…

Hansen, J., M. Sato, P. Hearty, R. Ruedy, M. Kelley, V. Masson-Delmotte, G. Russell, G. Tselioudis, J. Cao, E. Rignot, I. Velicogna, B. Tormey, B. Donovan, E. Kandiano, K. von Schuckmann, P. Kharecha, A.N. Legrande, M. Bauer, and K.-W. Lo, 2016: Ice melt, sea level rise and superstorms:/ evidence from paleoclimate data, climate modeling, and modern observations that 2 C global warming could be dangerous Atmos. Chem. Phys., 16, 3761-3812. doi:10.5194/acp-16-3761-2016.
World Nuclear Association - Hydrogen Production and Uses
From the “Anti-Nukes” at the World Nuclear Association.
https://world-nuclear.org/information-library/energy-and-the-environment/hydrogen-production-and-uses
UPDATED FRIDAY, 17 MAY 2024
- Hydrogen is increasingly seen as a key component of future energy systems if it can be made without carbon dioxide emissions.
- It is starting to be used as a transport fuel, despite the need for high-pressure containment.
- The use of hydrogen in the production of liquid transport fuels from crude oil is increasing rapidly, and is vital where tar sands are the oil source.
- Hydrogen can be combined with carbon dioxide to make methanol or dimethyl ether (DME) which are important transport fuels.
- …
IEA - Energy pathways in the NZE Scenario
(Please note: The following content is taken from a Creative Commons source.)
IEA (2025), World Energy Outlook 2025, IEA, Paris https://www.iea.org/reports/world-energy-outlook-2025, Licence: CC BY 4.0 (report); CC BY NC SA 4.0 (Annex A)
The NZE Scenario illustrates a possible global path to the goal of net zero emissions by 2050. Each country will have its own pathway, depending on their circumstances. The energy transition set out in the NZE Scenario has four main pillars: deployment of low-emissions sources of electricity and electrification to reduce emissions in end-uses; improvements in energy efficiency; use of low-emissions fuels such as hydrogen, biofuels, and CCUS; and reductions in methane emissions. These strategies rapidly reduce emissions and drive a demand-led transition away from fossil fuels in this scenario.
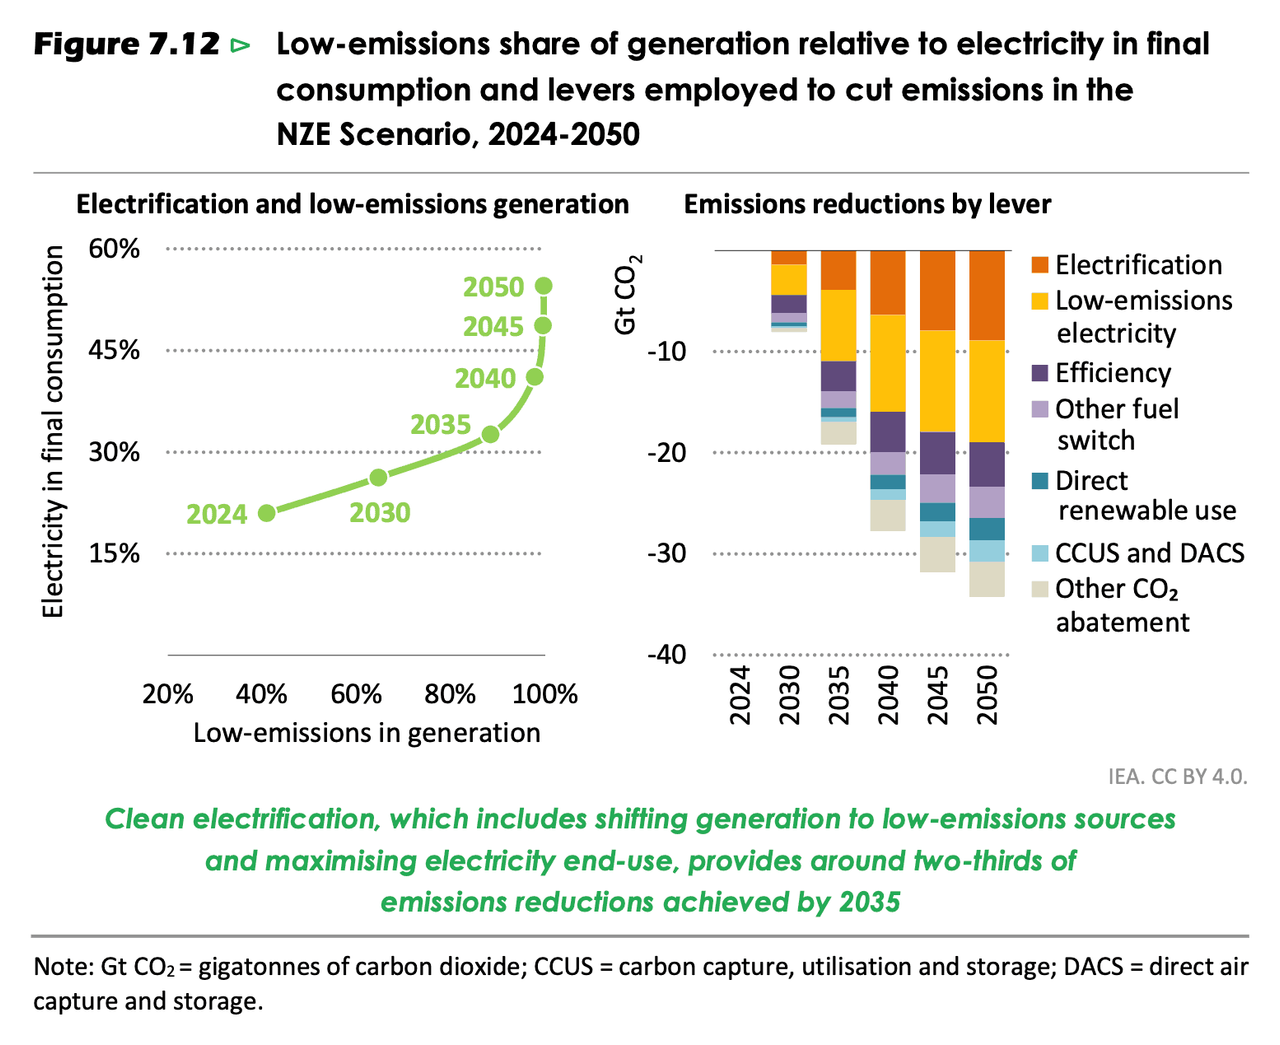
7.3.1 Clean electrification
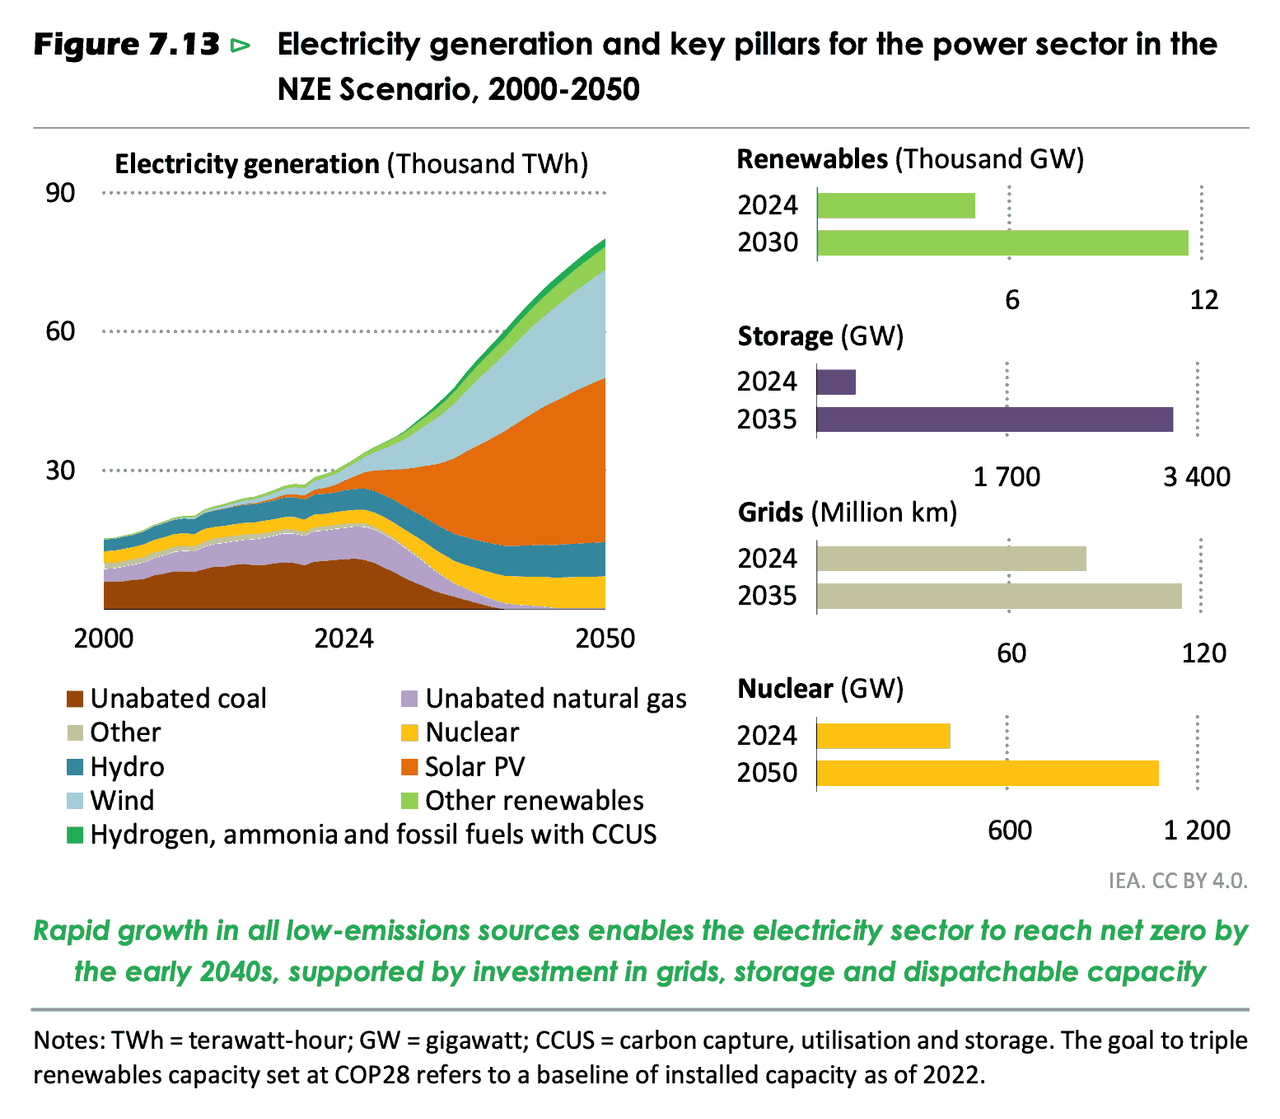
Today, the power sector accounts for about 40% of global energy-related emissions. Shifting electricity generation to low-emissions sources and increasing the deployment of lowemissions electricity in existing and new end-uses are central to the NZE Scenario: these strategies give rise to around two-thirds of the emissions reductions to 2035 (Figure 7.12). In the NZE Scenario, low-emissions sources provide nearly all electricity generation by 2040, while electricity increases its share in total final consumption to around 40% by 2040 and 55% by 2050. The expanding role of electricity in total final consumption and the increase in electricity supply from variable renewable sources underline the importance of electricity security in the NZE Scenario.
Generating electricity with low-emissions sources
Low-emissions sources of electricity – renewables, nuclear, fossil fuels with CCUS, hydrogen and ammonia – accounted for just over 40% of global electricity generation in 2024, up from around 30% a decade ago. Renewables were responsible for 32% of power generation worldwide, and nuclear for around 9%: there was also a very small contribution of less than 0.003% from fossil fuels equipped with CCUS.
Global installed capacity of renewables triples to 2030 from a 2022 baseline in the NZE Scenario, building on the strong momentum already seen in the power sector, and meeting the goal set at COP28 in 2023 (Figure 7.13). As a result, renewables expand from around one-third of total generation today to around three-quarters by 2035. Achieving this while maintaining electricity security means ensuring that investment in electricity system flexibility keeps pace. Having surged by over 80% in 2024, the installed capacity of stationary batteries increases 17-fold to 2035, average of 30% per year, reaching almost 2 900 gigawatts (GW) in capacity terms and more than 8 400 gigawatt-hours (GWh) in energy terms. In the NZE Scenario, investment surges in grid infrastructure, and around 30 million kilometres (km) of new transmission and distribution lines are added by 2035.
As variable renewables such as solar PV and wind account for a rising share of generation, dispatchable capacity plays a critical role to ensure electricity security. Long lead-times for nuclear limits its role in the near term, but installed nuclear capacity in the NZE Scenario increases 70% by 2035 from the current level, and by 2050 it is two-and-a-half times higher. By the 2030s, the nuclear industry delivers annual additions of around 40 GW per year (Box 7.3). Hydropower capacity also expands strongly, with generation increasing more than 1.5-times by 2050. Unabated fossil fuel plants are operated increasingly for flexibility and capacity adequacy, and consequently their installed capacity falls more slowly than their output across the Outlook period. Fossil fuel plants equipped with CCUS and plants fired with hydrogen or ammonia are also deployed, providing additional low-emissions dispatchable capacity.
IEA (2025), World Energy Outlook 2025, IEA, Paris https://www.iea.org/reports/world-energy-outlook-2025, Licence: CC BY 4.0 (report); CC BY NC SA 4.0 (Annex A)
World Nuclear Association: Carbon Dioxide Emissions From Electricity
https://world-nuclear.org/information-library/energy-and-the-environment/carbon-dioxide-emissions-from-electricity- Over 40% of energy-related carbon dioxide (CO₂) emissions are due to the burning of fossil fuels for electricity generation.
- All electricity generation technologies emit greenhouse gases at some point in their life-cycle.
- Nuclear fission does not produce any CO₂. For both nuclear and renewable generation, emissions are produced indirectly, for example during the construction of the plant.
- Over its life-cycle, nuclear produces about the same amount of CO₂-equivalent emissions per unit of electricity as wind, and about one-third that of solar.
But, CO₂ is not the whole story. As you have reminded us, thermal generation uses great amounts of water (wind and solar do not.)
https://world-nuclear.org/information-library/current-and-future-generation/cooling-power-plants
Updated Thursday, 1 October 2020
- The amount of cooling required by any steam-cycle power plant (of a given size) is determined by its thermal efficiency. It has essentially nothing to do with whether it is fuelled by coal, gas or uranium.
- However, currently operating nuclear plants often do have slightly lower thermal efficiency than coal counterparts of similar age, and coal plants discharge some waste heat with combustion gases, whereas nuclear plants rely on water.
- Nuclear power plants have greater flexibility in location than coal-fired plants due to fuel logistics, giving them more potential for their siting to be determined by cooling considerations.
The most common types of nuclear power plants use water for cooling in two ways:
- To convey heat from the reactor core to the steam turbines.
- To remove and dump surplus heat from this steam circuit. (In any steam/ Rankine cycle plant such as present-day coal and nuclear plants there is a loss of about two-thirds of the energy due to the intrinsic limitations of turning heat into mechanical energy.)
…
Please, let’s not pretend that renewables are environmental disasters compared to nuclear power plants.
Profile Information
Gender: Do not displayHometown: New York State
Home country: United States of America
Member since: Mon Mar 6, 2006, 04:51 PM
Number of posts: 22,403